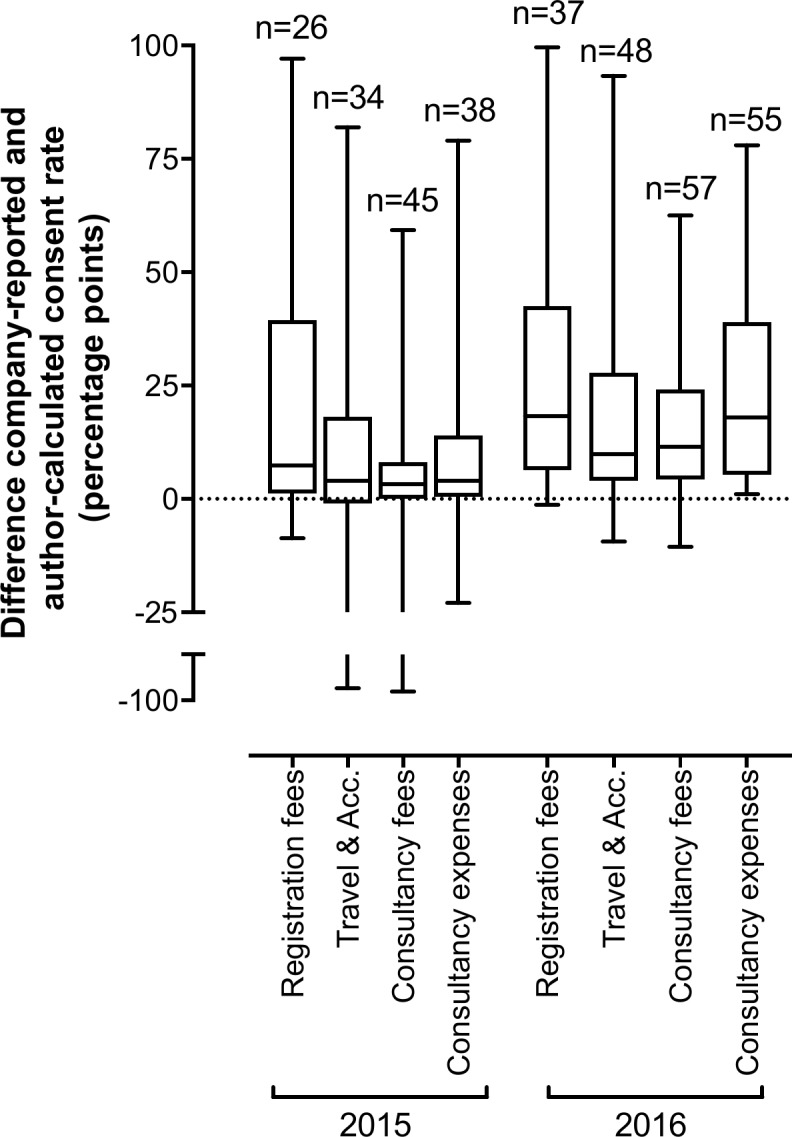
Figure 2.

Box plots show the difference in percentage points between company-reported and author-calculated healthcare professional consent rates for the number of ToVs in 2015 and 2016 for each ToV type. Only discordant pairs are shown, that is, differences larger than ±1.0% point. The number of discordant pairs (n) in each plot are shown. Reference line indicates 0% point difference. ToV, transfers of value.
