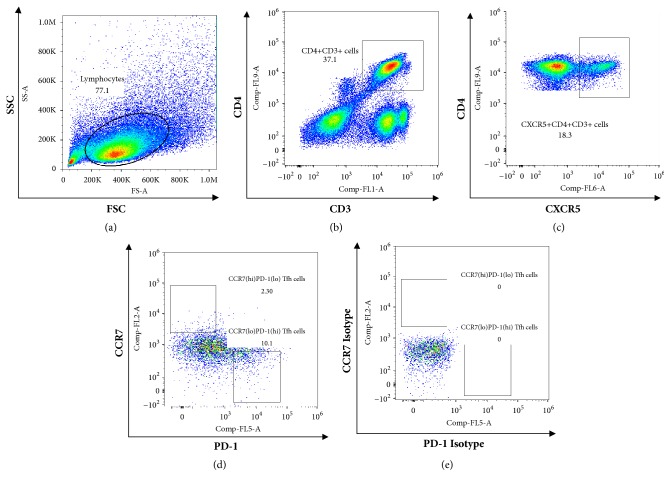
Figure 1.
Gating strategy and representative dot plots of CCR7 and PD-1 expression on CXCR5+CD4+ T cells from chronic HBV infected patients. (a) Living lymphocytes gate. (b) CD4+CD3+ cells gate. (c) CXCR5+CD4+CD3+ cells gate. (d) CCR7loPD-1hi Tfh cells gate and CCR7hiPD-1lo Tfh cells gate were set according the isotypes (e). At least approximately 100,000 events were analyzed in each sample.

