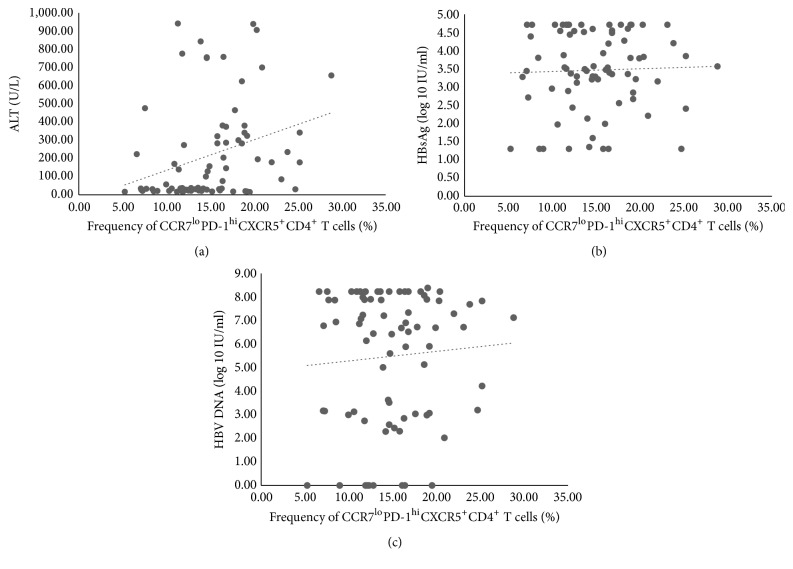
Figure 5.
Correlations between frequency of CCR7loPD-1hiCXCR5+CD4+ T cells and clinical indices. (a) Correlation between frequency of CCR7loPD-1hi Tfh cells and ALT level (r=0.370, p=0.001). (b) Correlation between frequency of CCR7loPD-1hi Tfh cells and HBV DNA load (p>0.05). (c) Correlation between frequency of CCR7loPD-1hi Tfh cells and HBsAg (p>0.05). Statistical comparison was performed using Spearman's rank correlation analysis.

