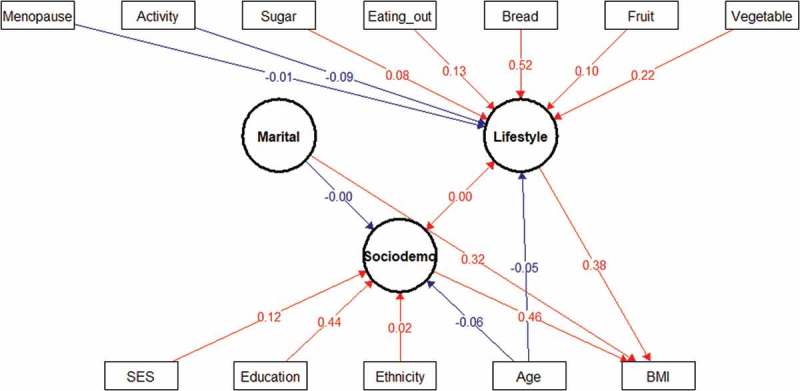
Figure 1.

Structural equation model (SEM) of interaction between sociodemographic and lifestyle factors and BMI in women. Latent variables are drawn as circles. Manifest or measured variables are shown as squares. Numbers refer to interactions (correlations) between an indicator and its factor. The blue lines indicate negative interactions and the in red lines indicate positive interactions. All interactions represented in the figure are significant. The variables were tested as both latent and manifest variables and only the most significant interactions were reported in the study.
