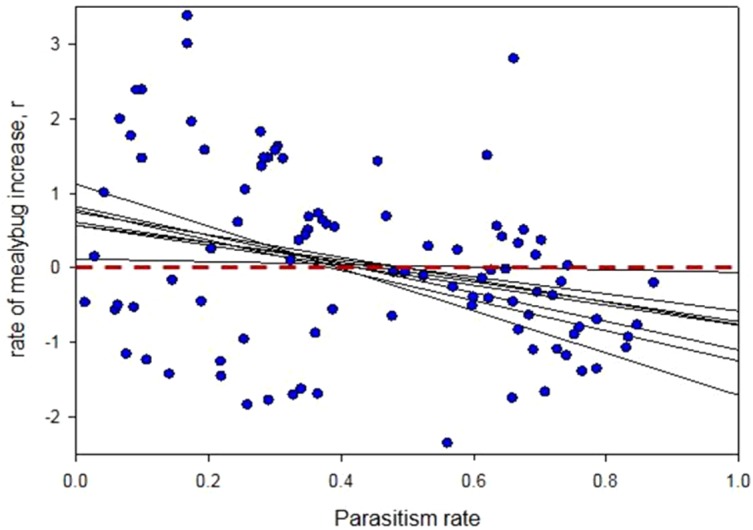
Figure 3. Effect of cassava mealybug parasitism rate on intrinsic rate of mealybug increase over consecutive 2-month periods in Tay Ninh, Vietnam.

Each dot represents a 2-month period in one of eight field plots. Thin lines are linear regressions per each of the eight sites monitored for illustrative purposes although the analysis was done on the entire data set. The thick black line shows the fit of the entire data set. The red dotted line shows r = 0; values above this on the y axis indicate positive growth of mealybug populations and below it indicate negative population growth. Parasitism level above which P. manihoti growth rates are negative ranged between 0.38 and 0.69 for the eight sites. See text for statistical details.
