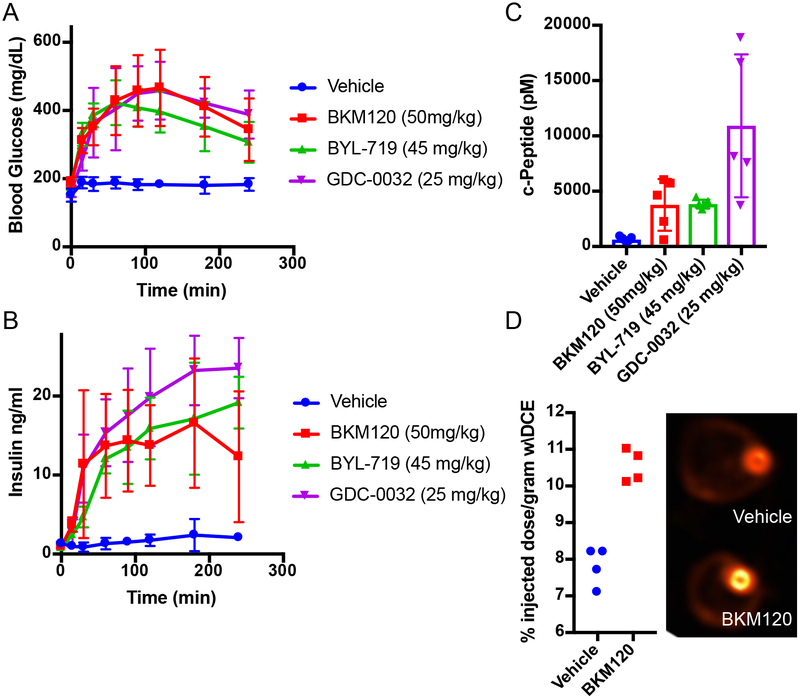
Figure 1: Treatment with PI3K inhibitors causes systemic feedback resulting in increases in blood glucose and insulin.
(A) Mean Blood glucose and (B) insulin levels with standard deviation in mice treated with the indicated PI3K inhibitor compounds (N=5/arm, p-value <0.0001 by Two-Way ANOVA for all curves as compared to vehicle). (C) Mean with standard deviation of c-Peptide levels assessed at 240 min (p-values comparing vehicle treatment to BKM120, BYL-719, and GDC-0032 by two sided t-test were 0.017, <0.0001, and 0.007 respectively). (D) Mean percent of FDG-PET signal with standard deviation of orthotopically implanted KPC tumors imaged 90 minutes after a single treatment with BKM120 (N=4/arm, p-value =0.0002, by two sided t-test).

