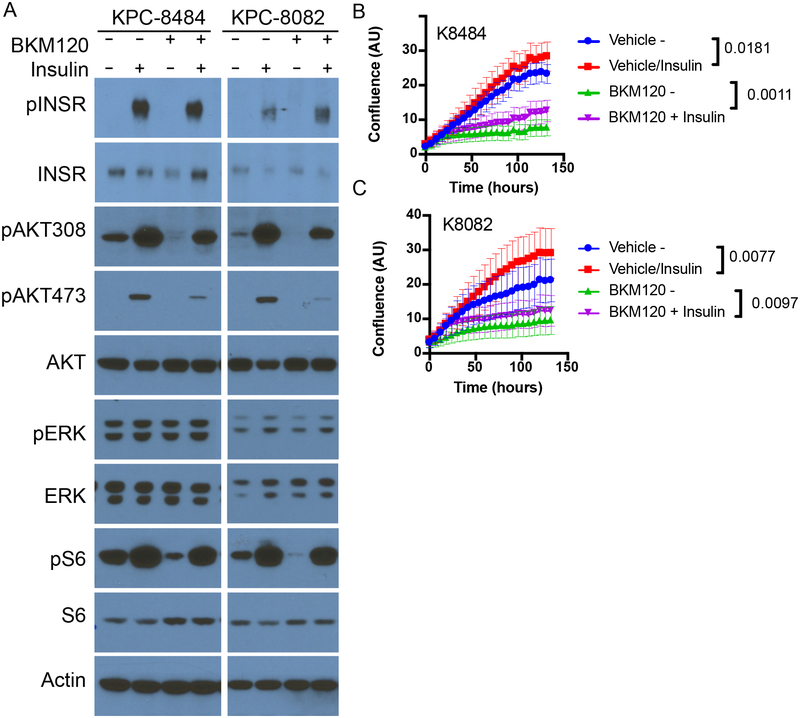
Figure 2: Impact of feedback levels of insulin on cellular proliferation, signaling and survival.
(A) Western blot analysis of KPC cell lines K8484 and K8082 treated with or without PI3K inhibitor BKM120 (1uM) in the presence or absence of physiologic feedback levels of insulin (10ng/ml). Similar results were observed in three independent experiments. (B-C) Mean confluence with standard deviation of KPC cell lines K8484 and K8082 over time grown in the presence or absence of insulin (10ng/ml) and BKM120 (1uM). p-values determined by ANOVA comparing conditions +/− insulin are shown, N=16 biologically independent samples per group.

