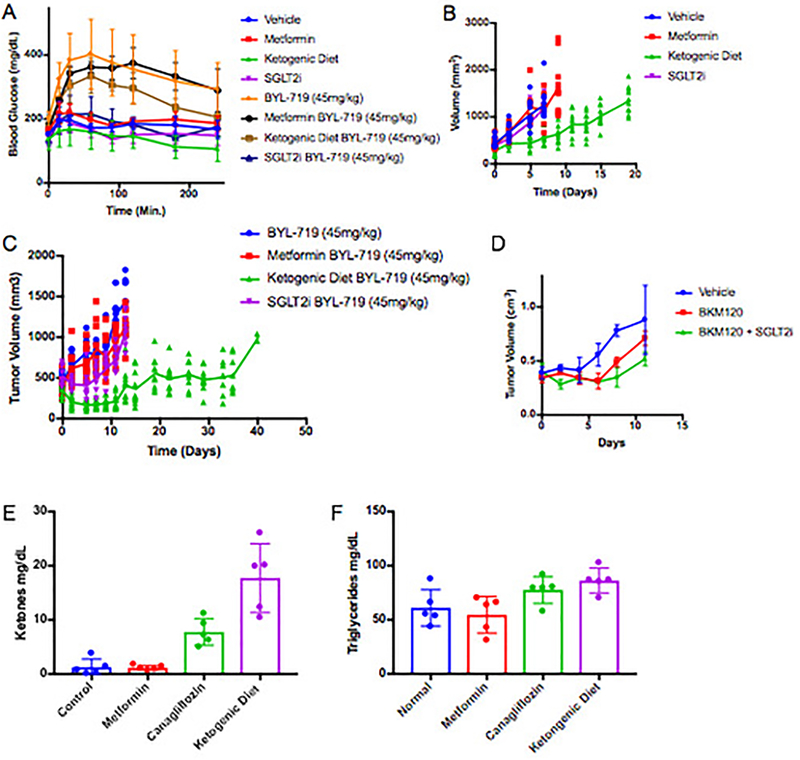
EF3: KPC K8484 Allografts treated with PI3K inhibitors with or without supplemental approaches to target systemic insulin feedback.
(A) Mean Blood glucose levels with standard deviation of mice from figure 3E–G treated with control diet, ketogenic diet, metformin (250mg/kg), or canagliflozin (SGLT2i)(6mg/kg), after the first dose of BYL-719 (45mg/kg). N=5 animals per arm. (B)Tumor volumes of the metabolic modifying agents as shown in figure 3 without PI3K inhibitors. N = 10 tumors per arm in Vehicle, Metformin, and Ketogenic Diet Arms, N = 8 tumors per arm in the SGLT2i arm. (C) Mean tumor volume (lines) with scatter (points) for each of these treatment cohorts. N = 10 tumors per arm in BYL-719, BYL-719 + Metformin, and BYL-719 + Ketogenic Diet Arms, N = 9 tumors in the BYL-719 + SGLT2i arm. (D) Mean tumor volumes with standard deviation from an independent experiment of mice (N = 4 mice/arm) treated daily with BKM120 with or without 6mg/kg of Canagliflozin administered 60 minutes prior to the PI3K treatment so that peak SGLT2 inhibition is aligned with peak blood glucose levels post PI3K inhibitor treatment. (E) Blood ketone and (F) Mean triglyceride levels with standard deviation as determined by Calorimetric assay of mice shown in figure 3A–D after a single treatment with BKM120 with or without pretreatment with metformin, Canagliflozin, or the ketogenic diet as indicated, N = 5 mice per arm.

