
Figure 1.
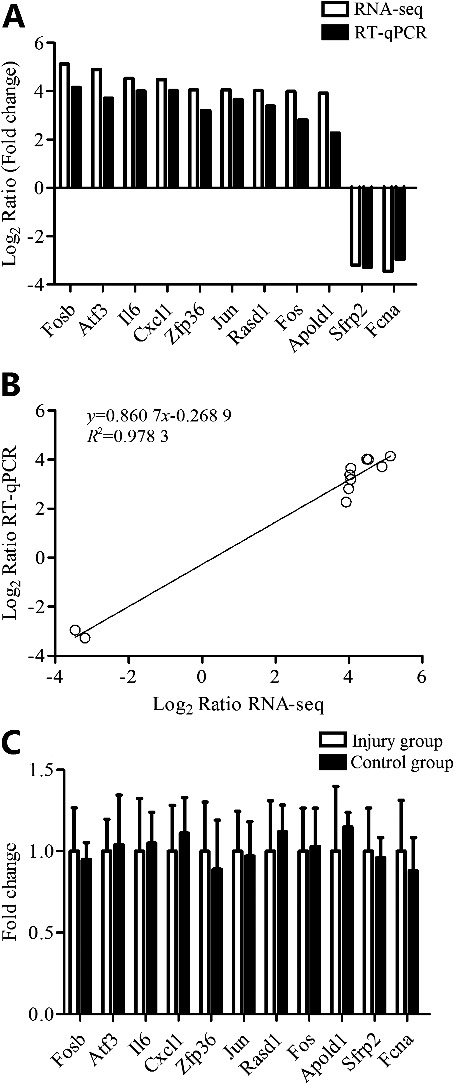
RT-qPCR validation of 11 DEGs. (A) The transcript expression fold changes measured by RNA-seq and RT-qPCR are indicated by white and black columns, respectively. (A and B) The expression levels of nine up-regulated genes, Fosb, Atf3, IL6, Cxcl1, Zfp36, Jun, Rasd1, Fos and Apold1, two down-regulated genes, Sfrp2 and Fcna, were all consistent with the RNA-seq data. (B) The regression equation between RNA-seq (x) and RT-qPCR (y) data (Log2 Ratio) is y = 0.860 7x − 0.268 9, while the R2 is 0.978 3. (C) Those 11 DEGs showed no difference between abdominal skins of the injury group (RT-qPCR-A) and control group (RT-qPCR-B).