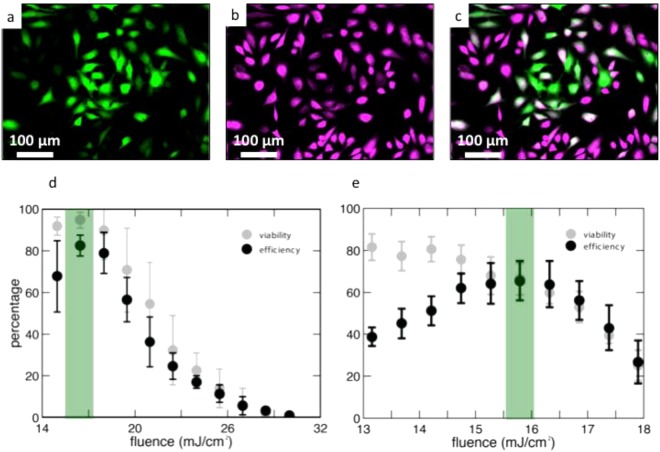
Figure 4.
Cell poration efficiency and viability results. (a–c) represent an example of cell counting methodology (a) Green cells represent cells that were porated and uptook calcein Green dye. (b) The same area of cells showing the cells that survived. (c) An overlay of (a) and (b). (d) Quantified efficiency and viability results for the inverted pyramid substrate. The green bar highlights the optimal fluence for maximum efficiency and viability. (e) Quantified efficiency and viability results for the upright pyramids. The green bar highlights the optimal fluence for maximum efficiency and viability. Error bars represent +/−SEM with n = 3.

