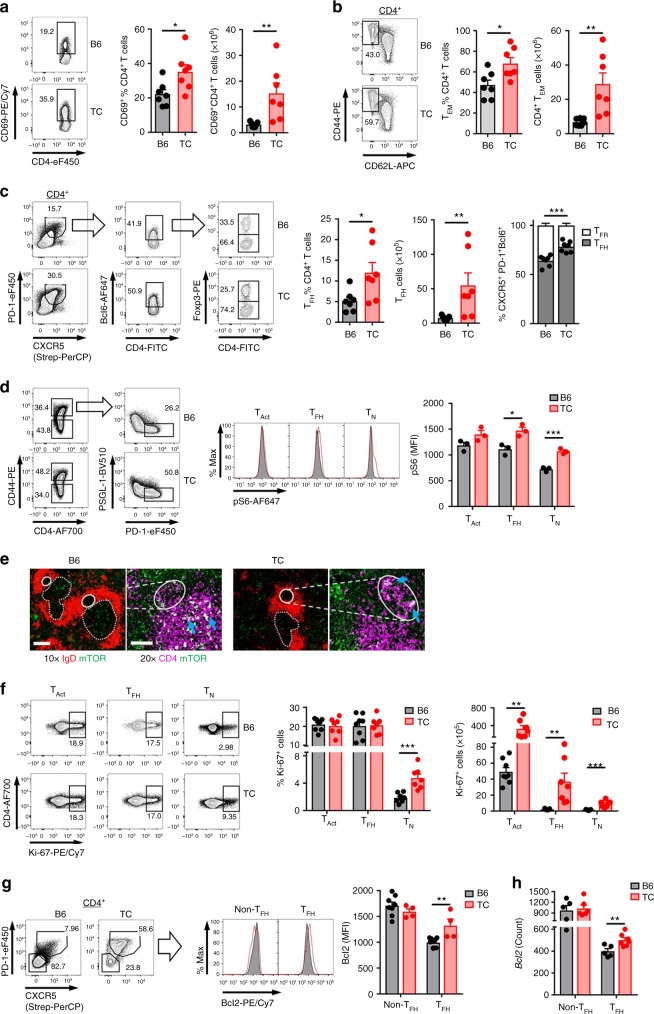
Fig. 1.
Increased mTORC1 activity and survival in TC TFH cells. a–c Frequency and cell number of CD69+ (a), CD4+CD44+CD62L− TEM cells (b), and CD4+CXCXR5+PD1+Bcl6+Foxp3− TFH (c) in CD4+ T cells, with the relative distribution of TFH and Foxp3+ TFR cells in CD4+CXCXR5+PD1+Bcl6+ cells. d Mean fluorescence intensity (MFI) of phospho-S6 in TN cells (CD4+CD44−), TAct cells (CD4+CD44+), and TFH cells (CD4+CD44+PD-1hiPSGL-1lo). e Representative mTOR staining (green) in the GC (plain line) and T cell zone (dashed line) relative to non-GC B cells (IgD+ red) and CD4+ T cells (purple). Arrows point to examples of mTOR staining. Scale bars: 200 μM for 10× and 10 μM for 20×. f Frequency and number of Ki-67+ proliferating TN, TAct, and TFH cells. g Bcl2 MFI in CD4+CXCXR5+PD1+ TFH and CD4+CXCXR5−PD1− non-TFH cells, with representative FACS plots on the left. h Bcl2 mRNA expression in TFH and non-TFH cells as determined with a Nanostring custom panel. Spleens from 9-month-old B6 and TC mice, mean + s.e.m. of N = 3–8 mice per group compared with t tests. *P < 0.05, **P < 0.01, and ***P < 0.001

