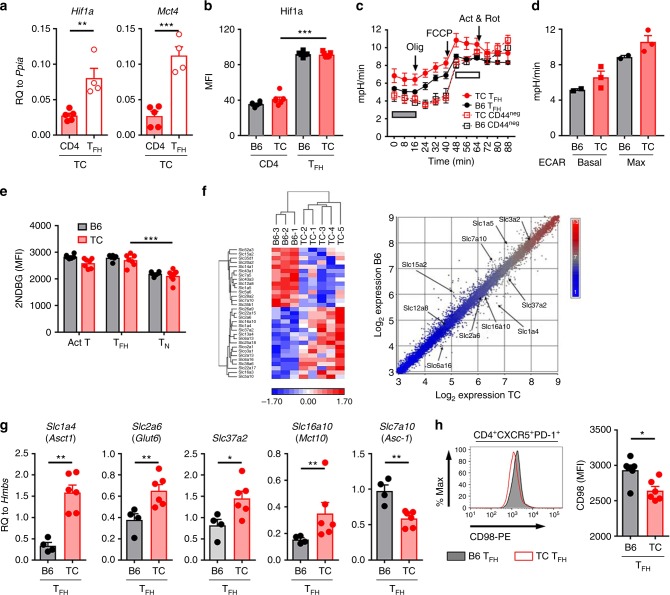
Fig. 5.
Spontaneous TC TFH cells are glycolytic and show an altered expression of solute transporters. a Hif1a and Mct4 gene expression was compared between total CD4+ T cells and TFH cells (CD4+CXCR5+PD-1+) from TC mice using qRT-PCR and normalized to Ppia. b Hif1α protein expression (as determined by MFI using flow cytometry) in total CD4+ T cells and TFH cells from B6 and TC mice. c–d ECAR during a mitochondrial stress test conducted on TFH (CD4+CD44+PD-1hiPSGL-1lo) and CD44− CD4+ T cells from B6 and TC mice. c Time-course with the arrows indicating the addition of oligomycin (Olig), trifluoromethoxy carbonylcyanide phenylhydrazone (FCCP), and actimycin A and rotenone (Act & Rot). The horizontal gray bar indicates the three time-point measurements of basal ECAR, and the white bar indicates maximum ECAR. The TC and B6 TFH cells plots were significantly different (two-way ANOVA, P < 0.001). d Basal and max ECAR averages in B6 and TC TFH cells. e 2NDBG uptake by B6 and TC TN cells (CD4+CD44−), TAct cells (CD4+CD44+), and TFH cells (CD4+CD44+PD-1hiPSGL-1lo). f Microarray heat-map and scatter plot of solute transporter genes differentially expressed between B6 and TC TFH cells. Heatmap coloring is mean centered (white), standard deviation normalized to 1 with red indicating above average expression and blue for below average expression. Dotplot coloring is based on signal intensity RMA normalized values, blue is lowest expression and red is highest expression. Selected genes are labeled and only the range 3–9 is shown on dotplot. g Expression of solute transporter genes in TFH cells was analyzed using qRT-PCR, and normalized to Hmbs. h Representative FACS plot (left) and MFI (right) of CD98 expression on TC and B6 TFH cells. All T cells were isolated from spleens from 7–8 month-old mice. Mean + s.e.m. of N = 4–7 per strain, compared with t tests (a, b, d, e, g, h), *P < 0.05, **P < 0.01, and ***P < 0.001

