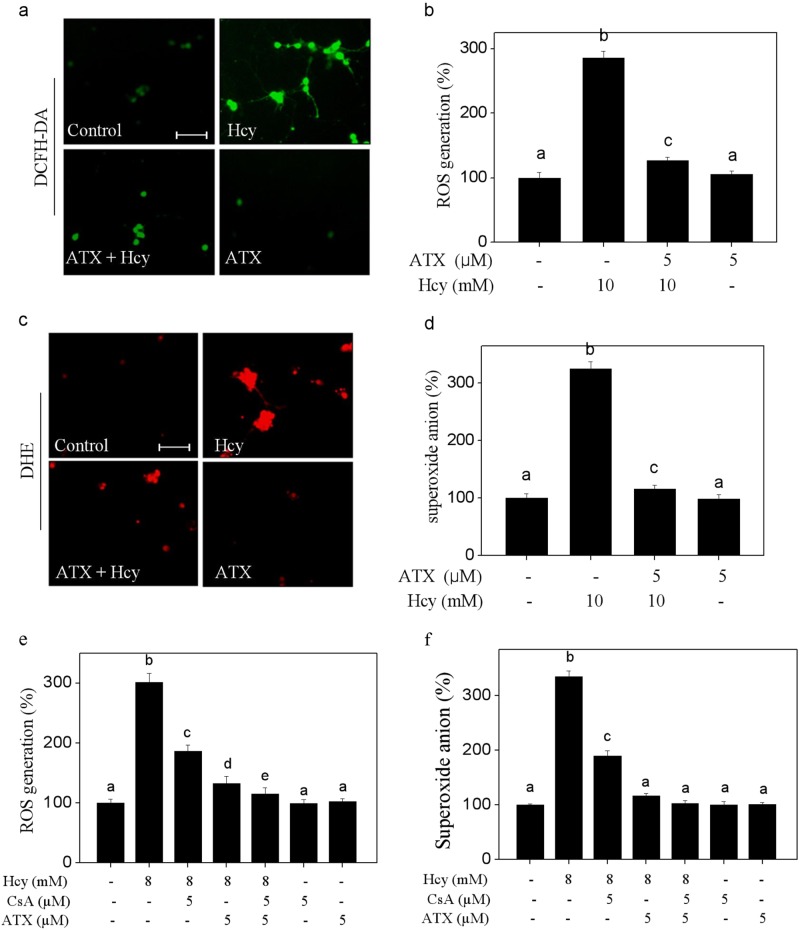
Fig. 4. ATX Attenuates Hcy-induced accumulation of ROS and superoxide anion.
a Detection of ROS. b Quantitative analysis of ROS generation. c Detection of superoxide anion. d Quantitative analysis of superoxide anion generation. ROS and superoxide anion were detected by HCFH-DA and DHE probes (magnification, ×200), respectively as described in the section of methods. e Effect of CsA on ROS generation in neurons. f Effect of CsA on superoxide anion in neurons. Neurons were pre-treated with 5 μM CsA for 2 h before combined treatment. Generation of ROS and superoxide anion was detected by DCFH-DA and DHE staining, respectively. Scale bar in figures indicates 50 μm. All data and images were obtained from three random experiments. Bars with different letters indicate the statistic difference at P < 0.05

