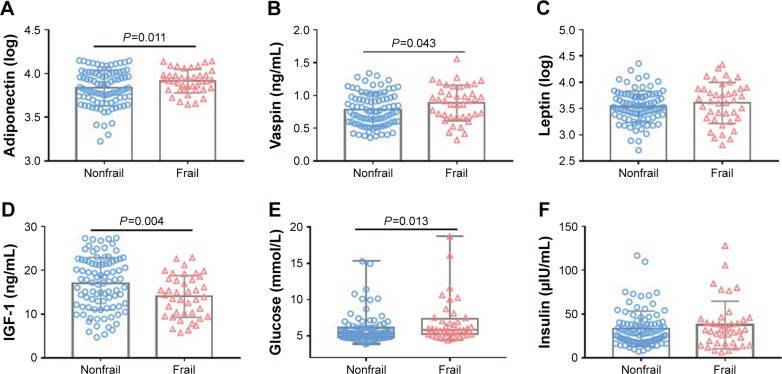
Figure 2.
Comparison of circulating adipokines and insulin pathway between frail and nonfrail old adults.
Notes: One hundred thirty older adults were divided into two groups: nonfrail group (n=90) and frail group (n=40). Values in the figure were expressed as mean (SD) or median (IQR). Levels of adiponectin (A), vaspin (B), leptin (C), IGF-1 (D), glucose (E) and insulin (F) were compared between the two groups.
Abbreviation: IGF-1, insulin-like growth factor 1.

