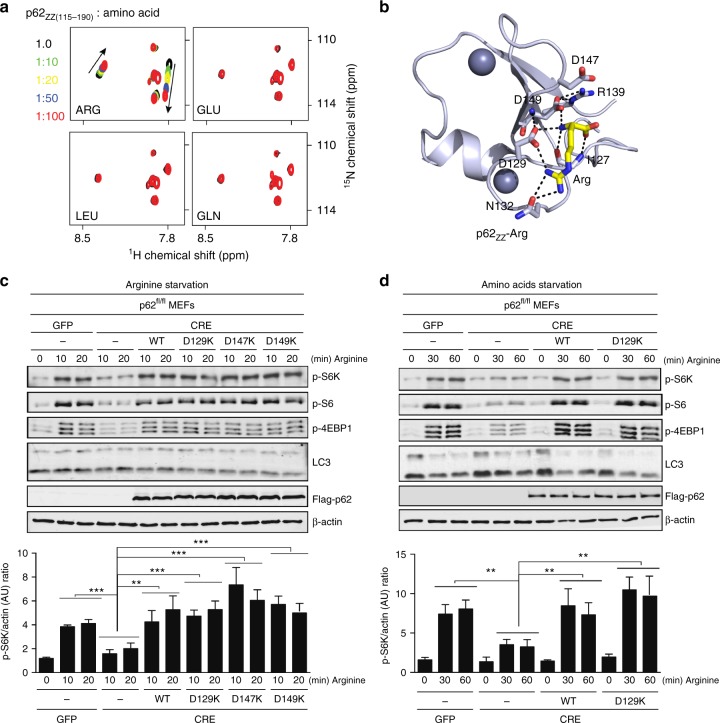
Fig. 5.
p62 is not a direct arginine sensor in mTORC1 pathway. a Superimposed 1H,15N HSQC spectra of p62ZZ (115–190) collected upon titration with the indicated free amino acids. Spectra are color coded according to the protein:ligand molar ratio. b A ribbon diagram of the crystal structure of p62ZZ (wheat) in complex with the amino-acid arginine (yellow). c Mouse p62fl/fl embryonic fibroblasts infected with GFP or CRE adenoviruses were reconstituted with retroviruses expressing Flag-p62 WT, D129K, D147K, or D149K. Cells were deprived of arginine for 4 h and then stimulated with arginine for the indicated durations. Cell lysates were analyzed for the levels of the specified proteins. Graphs represent p-S6K/actin ratio as measured by densitometry using Image studio software (n = 3 independent experiments). d p62fl/fl MEFs cells infected with GFP or CRE adenoviruses and stably expressing Flag-p62 WT or D129K, were deprived of amino acids for 4 h and then stimulated with arginine for the indicated durations. Cell lysates were analyzed for the levels of the specified proteins. Graphs represent p-S6K/actin ratio as measured by densitometry using Image studio software (n = 3 independent experiments). Two-way ANOVA test **p < 0.01, ***p < 0.001. Error bar in c and d represents s.e.m. with N of 3

