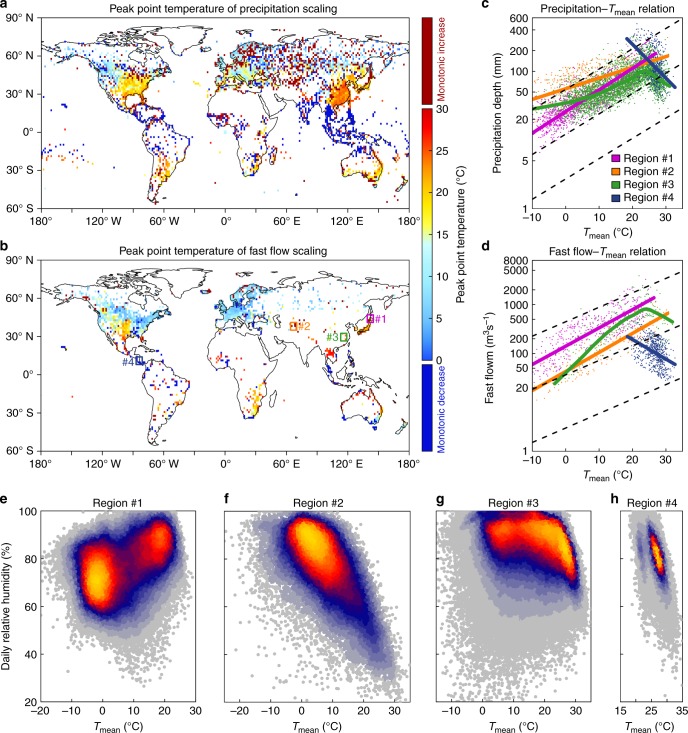
Fig. 2.
Peak point temperature for percentile 99th extreme with daily mean temperature and extremes and relative humidity varying with temperature over four example regions. a, b Peak point temperature of precipitation extremes (a), and fast flow extremes (b). c, d Relationship between Tmean with precipitation extremes (c), and fast flow extremes (d). e–h Relative humidity on wet day varying with Tmean over four example regions, i.e., Region #1 (e), Region #2 (f), Region #3 (g) and Region #4 (h). Region #1 in north Japan (139°E–145°E, 41°N–47°N), Region #2 in western Asia (64°E–70°E, 35°N–41°N), Region #3 in southeastern China (113°E–119°E, 27°N–33°N) and Region #4 in Central America (81°W–87°W, 8°N–14°N). The solid curves in c, d are fitted with extreme-temperature scatters using the LOWESS method, while the solid lines are fitted by linear regression method (p value < 0.05). Dashed lines are C–C scaling

