Figure 1.
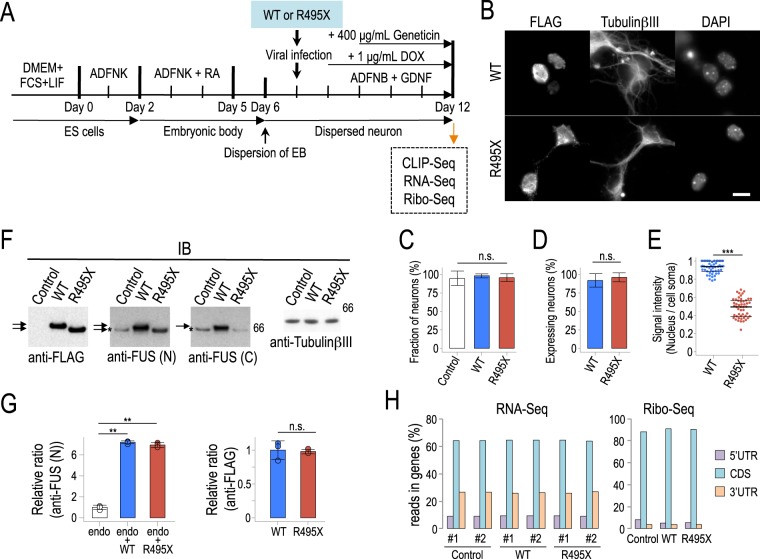
CLIP-Seq, RNA-Seq and Ribo-Seq on human FUS WT- or R495X-expressing neurons. (A) Schematic of the experimental design for CLIP-Seq, RNA-Seq and Ribo-Seq library preparation from mouse ES cell derived neurons. (B) Immunostaining for cellular localization of NFLAG-hFUSWT (WT) and NFLAG-hFUSR495X (R495X) in neurons. Anti-FLAG (left), anti-TubulinβIII (middle) and DAPI stain (right) are shown. Scale bar, 10 μm. (C) Bar plot for fraction of neurons over all cells for Control, WT- and R495X-expressing cells. Error bars indicate standard deviation (N = 18). n.s., not significant (p = 0.253), one-way ANOVA test. (D) Bar plot for percentage of neurons expressing WT and R495X. Error bars indicate standard deviation (N = 18). n.s., not significant (p = 0.115), two-tailed Student’s t-test. (E). Beeswarm plot for ratio of nuclear localization of WT and R495X in neurons. Ratio represents fluorescence intensity in the nucleus over cell soma. N = 50. ***p = 2.83 × 10−40, two-tailed Student’s t-test. Black bars represent median, 25th and 75th percentiles. (F) Immunoblots showing expression levels using the indicated antibodies for FLAG, amino- (FUS(N)) and carboxyl-terminal FUS (FUS(C)) and TubulinβIII. Arrows and asterisk indicate exogenous and endogenous FUS proteins, respectively. Protein standard is shown on the right. (G) Quantification of endogenous (endo) and exogenous WT and R495X FUS proteins detected by anti-FUS (N) (left) and anti-FLAG (right). N = 3. **p < 0.0001 one-way ANOVA and p < 0.01 in post Tukey’s HSD test for left graph. n.s., not significant (p = 0.827) two-tailed Student’s t-test for right graph. (H) Distribution of gene mapping reads in the 5′UTR, coding sequence (CDS) and 3′UTR for RNA-Seq and Ribo-Seq.

