Figure 2.
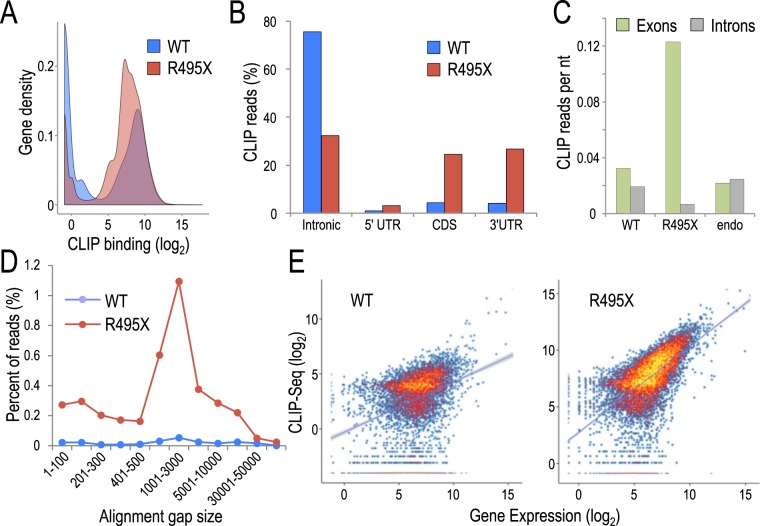
Identification of RNA binding property of R495X compared to WT. (A) Gene density plot of CLIP binding for WT (blue) and R495X (red). (B) Distribution of CLIP-Seq reads in introns, 5′UTR, coding sequence (CDS) and 3′UTR for WT (blue) and R495X (red). (C) Distribution of CLIP-Seq reads in exons (green) and introns (grey) normalized by the total length of these elements for WT, R495X and endogenous FUS (endo). (D). Alignment gap size distribution of CLIP-Seq reads for WT (blue) and R495X (red) reads. Only alignment gaps overlapping annotated introns are used. (E) Scatter plot for FUS binding versus gene expression levels for WT (left) and R495X (right). Color indicates gene density with yellow and blue indicating higher and lower values respectively.

