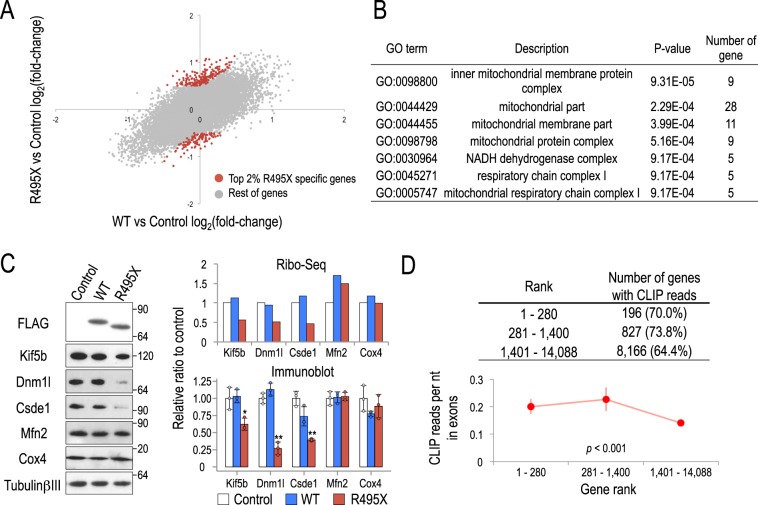
Figure 4.
Differential gene translation analysis for WT- and R495X-expressing neurons. (A) Scatter plot of WT versus control and R495X versus control differential gene translation. The top 2% (280) differentially translated genes that are specific to R495X are shown in red. (B) Gene ontology enriched terms for the top 2% (280) differentially translated genes specific to R495X compared to the remaining genes. (C) Immunoblots of differentially translated genes in R495X-expressing neurons (left). Bar plots for gene translational levels quantified from Ribo-Seq (top right) and protein band intensities quantified from immunoblots (bottom right). Protein standard is shown on the right. Band intensities were normalized by TubulinβIII and the average value for control was set to 1. P-values in one-way ANOVA are, 0.01, < 0.0001, 0.001, 0.725 and 0.257 for Kif5b, Dnm1l, Csde1, Mfn2 and Cox4, respectively. *p < 0.05, **p < 0.01 to control in post Tukey’s HSD test. Error bar indicates standard deviation (N = 3). (D) Number of genes that are bound by R495X for gene sets of decreasing differential translation in R495X (top) and R495X binding density in gene exons for the same gene sets (bottom). Error bars indicate standard error. P-value, one-way ANOVA test.

