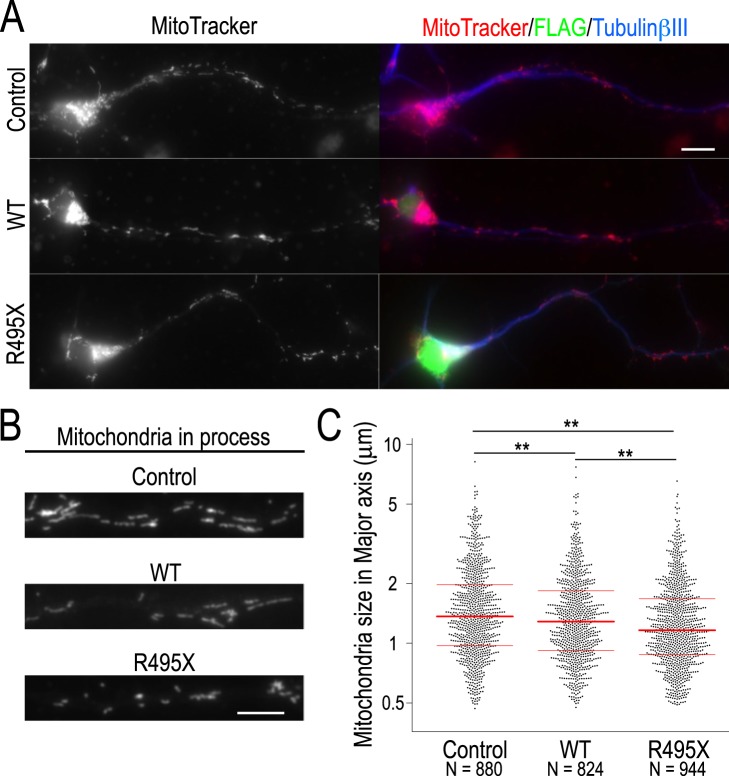
Figure 5.
Mitochondria size for control, WT- and R495X-expressing neurons. (A) Images of mitochondria stained with MitoTracker (left) and merged images stained with anti-FLAG antibody (green), anti-TubulinβIII (blue) and MitoTracker (red) (right) for control (top), WT- (middle) and R495X-expressing neurons (bottom). Scale bar, 10 μm. (B) Magnified images of MitoTracker stained neuronal processes for control (top), WT- (middle) and R495X-expressing neurons (bottom). Scale bar, 5 μm. (C) Beeswarm plot for mitochondria major-axis length in control, WT- and R495X-expressing neurons. The number of analyzed mitochondria is indicated at the bottom. Red lines indicate the median, 25th and 75th percentiles. p < 0.0001, one-way ANOVA. **p < 0.01, post Tukey’s HSD test.

