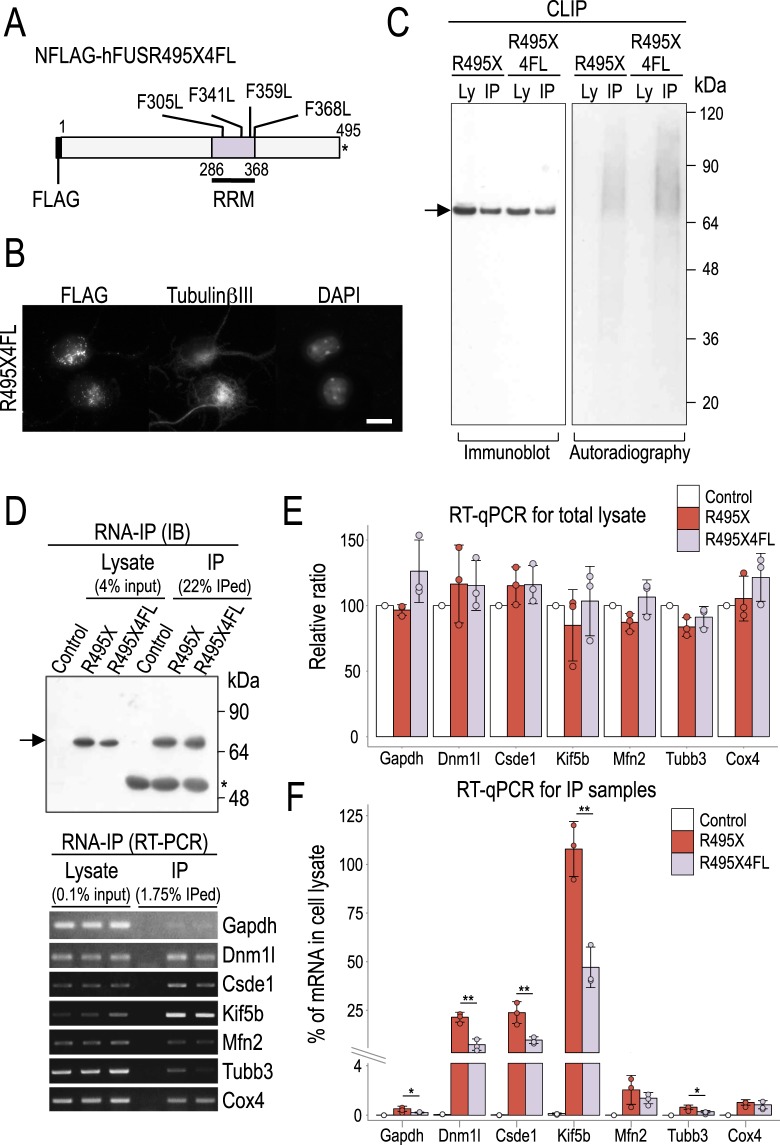
Figure 6.
The RNA binding profile of R495X4FL mutant. (A) Schematic of the NFLAG-hFUSR495X4FL (R495X4FL) mutant structure. The 4 Phenylalanines at the indicated positions of the FUS RRM were substituted to Leucines. Asterisk indicates stop codon. (B) Immunostaining images for anti-FLAG (left), anti-TubulinβIII (middle) and DAPI stain (right) show the cellular localization of R495X4FL in neurons. Scale bar, 10 μm. (C) Cell lysate (Ly) and CLIP samples (IP) with a rabbit anti-FLAG polyclonal antibody from neurons expressing R495X or R495X4FL were analyzed by immunoblot with a mouse monoclonal anti-FLAG antibody (left panel) and autoradiography (right panel). Arrow indicates FLAG tagged proteins. The numbers at the right indicate protein standards. (D) Immunoblot of cell lysate and IP samples using anti-FLAG antibody (top). Arrow indicates FLAG tagged proteins. The numbers at the right indicate protein standards. Asterisk indicates IgG heavy chain. RT-PCR using RNA samples from cell lysate and IP samples for the genes indicated at the right (bottom). (E) Gene expression levels measured by qPCR from total RNA from cell lysate. Control expression was set to 100% and the relative gene expression was measured. Error bar indicates standard deviation (N = 3). No statistically significant difference was observed for any gene. P-values in one-way ANOVA are, 0.077, 0.574, 0.250, 0.579, 0.079, 0.051 and 0.243 for Gapdh, Dnm1l, Csde1, Kif5b, Mfn2, Tubb3 and Cox4, respectively. (F) Gene expression levels measured by qPCR for RNA from IP samples. mRNA abundance is measured as percent of input. Lower part corresponds to [0, 4]%, while upper part to [4, 125]%. P-values in one-way ANOVA are, 0.006, < 0.0001, 0.0004, < 0.0001, 0.035, 0.001 and 0.004 for Gapdh, Dnm1l, Csde1, Kif5b, Mfn2, Tubb3 and Cox4, respectively and *p < 0.05 and **p < 0.01 between R495X and R495X4FL in post Tukey’s HSD test. Error bar indicates standard deviation (N = 3).

