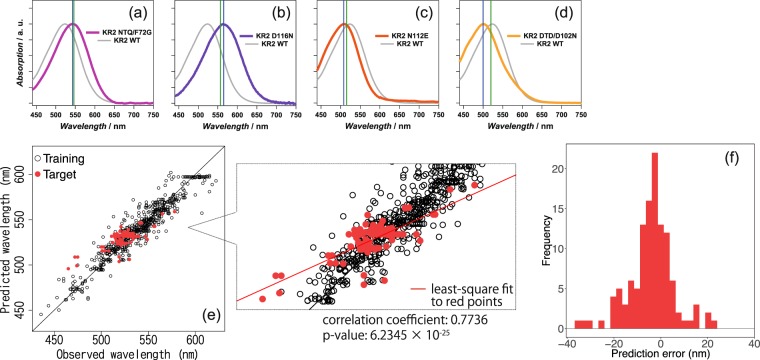
Figure 6.
Absorption wavelength prediction results for KR2 wildtype and its 118 variants. (a–d) Absorption spectra of KR2 mutants ((a) KR2 NTQ/F72G, (b) D116N, (c) N112E, and (d) DTD/D102N) with their absorption maxima as predicted by ML analysis (green lines) and experimentally determined (blue lines). The spectrum of KR2 wildtype is indicated by the solid grey line. (e) The horizontal axis represents the experimentally observed absorption wavelengths, whereas the vertical axis represents the absorption wavelengths predicted by the ML model. The red points indicate the KR2 group rhodopsin proteins in the target set, whereas the black points indicate other rhodopsin proteins in the training set. (f) Histogram of the prediction errors for KR2 group proteins in the target set.

