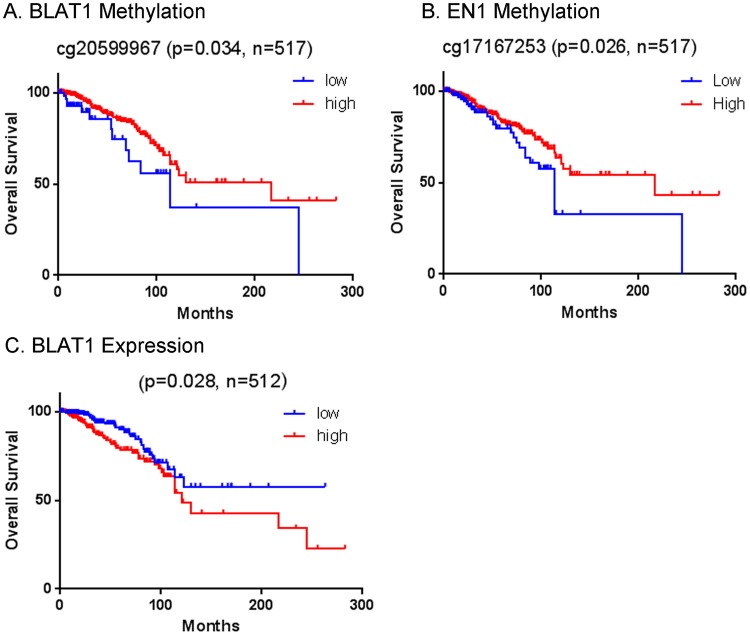
Figure 7.
The Promoter Methylation Levels of BLAT1 and EN1 Are Associated with Clinical Outcomes. (A,B) The Kaplan–Meier estimator shows poor overall survival in patients with lower levels of the BLAT1 (beta value < 0.2) (A) and EN1 (B) promoter methylation, compared to those with higher levels of methylation (beta value > 0.2) (p = 0.034 and p = 0.026, respectively). (C) Patients with higher expression of BLAT1 (>median) have worse survival than those with lower expression (<median) of BLAT1 (p = 0.028).

