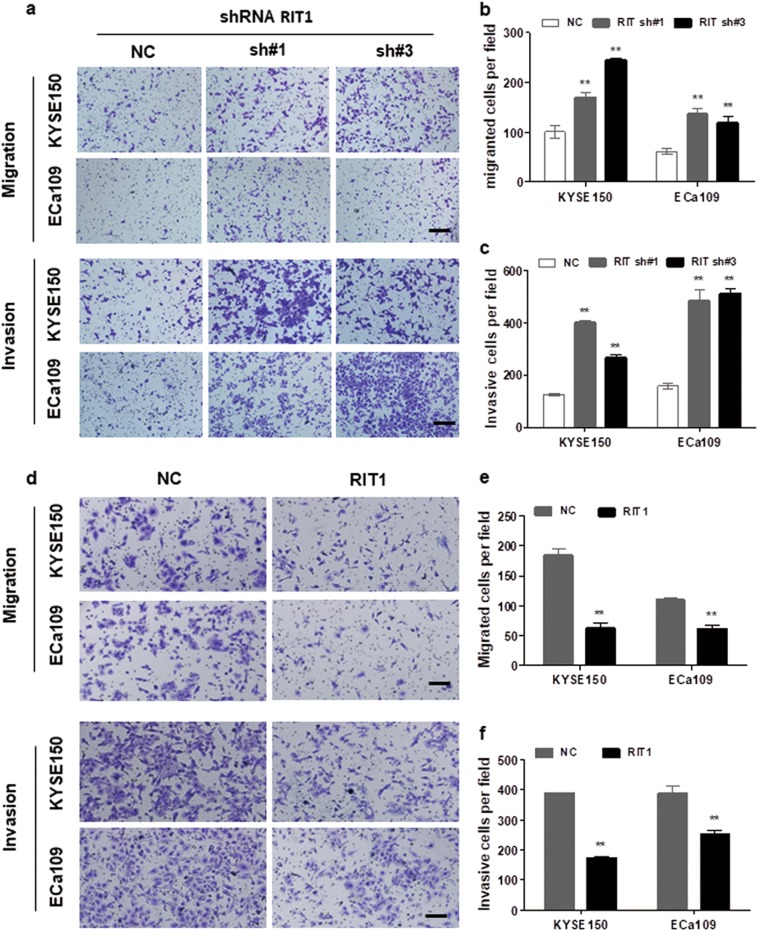
Fig. 3. RIT1 inhibited invasion and migration of ESCC cells.
a–c Transwell assay was performed to compare migration and invasion between cells treated with shRNAs and NC. a Representative images of migrated or invasive cells are shown (original magnification: ×100, calibration bar 50 μm). b, c Results are statistically analyzed. d–f Cell motilities tested by transwell assay were compared between cells treated with RIT1 expression plasmid and NC. d The representative images of migrated or invasive cells are shown (original magnification: ×100, calibration bar 50 μm). e, f Results are statistically analyzed. The presented figures are representative data from at least three independent experiments. **P < 0.01 for statistical analysis of the indicated groups

