Fig. 1.
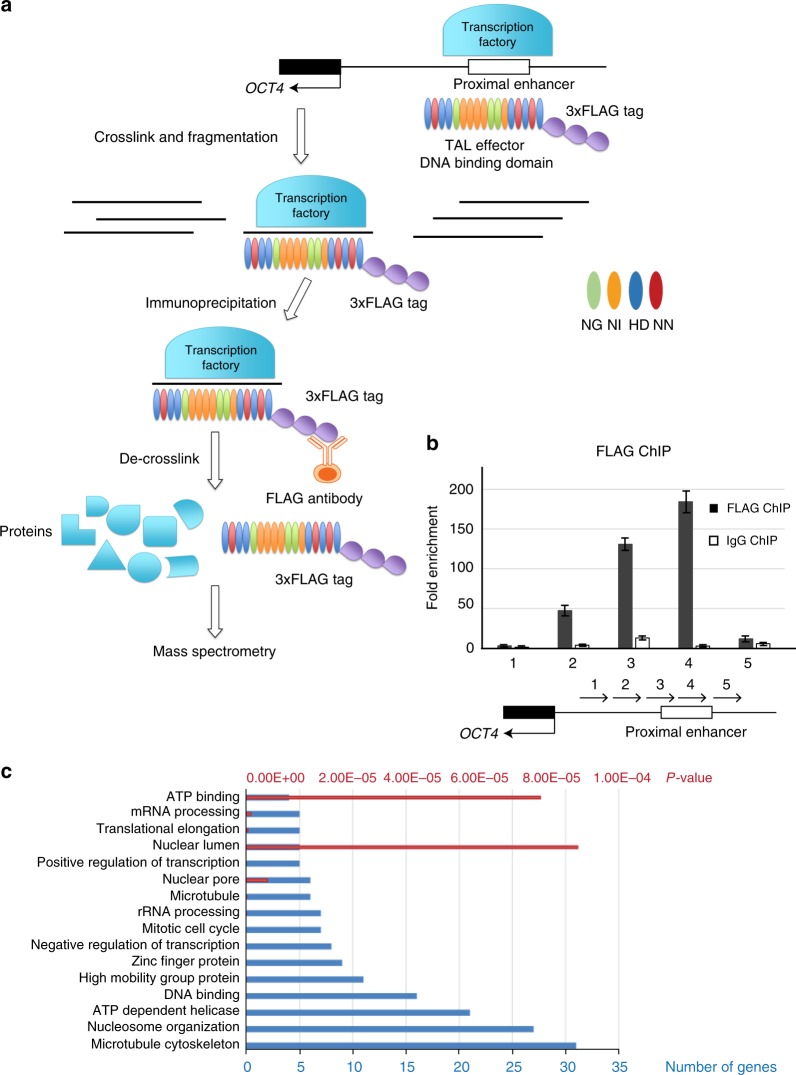
Locus-specific proteomics identified proteins located at the proximal enhancer of OCT4 gene in hESCs. a Schematic overview of locus-specific proteomics in hESCs. A representation of OCT4 locus is shown on the top. Dark boxes represent exons, and the white box represents the proximal enhancer that is bound by the transcription factory. TALEN protein with a 3xFLAG tag was designed to bind to the proximal enhancer. The colored ovals represent the “repeat-variable di-residues” (RVD) of TALEN protein that determines binding specificity to DNA bases. They follow the code that NG, NI, HD, and NN respectively recognizes thymine, adenine, cytosine, and guanine. Chromatin is crosslinked by formaldehyde and fragmented by sonication. Then, FLAG antibody was used for immunoprecipitation of proteins bound to the proximal enhancer. The pull-down complex was de-crosslinked of the identity of isolated proteins was discovered by mass spectrometry. b Validation of the binding of dTALE protein by ChIP. A ChIP assay was performed using anti-flag antibody to detect enriched fragments in hESCs. Fold enrichment is the relative abundance of DNA fragments at the amplified region over a control amplified region. IgG ChIP is served as control. The locations of the amplified products are indicated by arrows along the proximal promoter of OCT4. Data are presented as the mean ± SEM and are derived from three independent experiments. c Gene ontology analysis of the proteins identified by locus-specific proteomics. Blue bars represent the number of genes and red bars represent p-value. p-value is calculated using hypergeometric distribution

