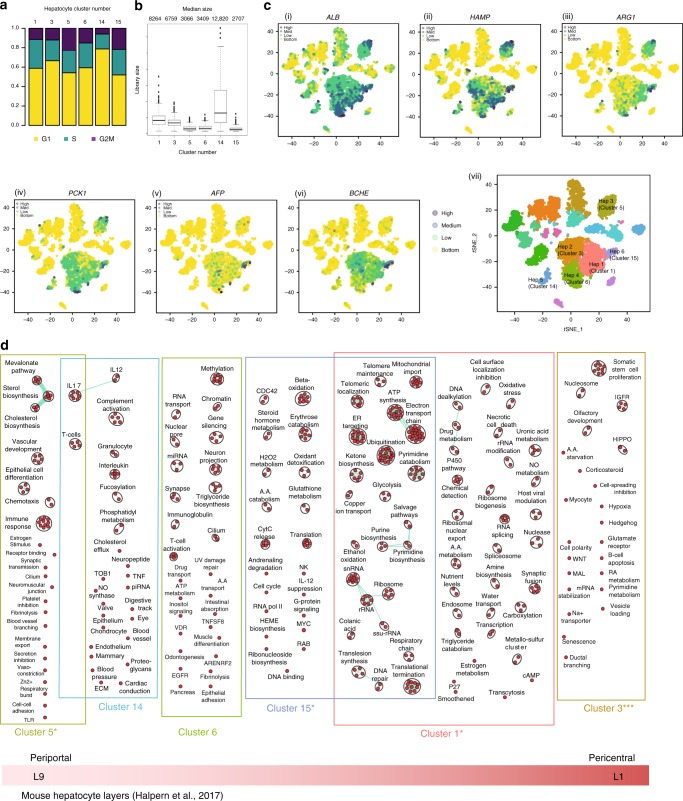
Fig. 4.
ScRNA-seq analysis of hepatocyte populations. a Distribution of hepatocytes by cell-cycle phase (G1, G2/M, S) and hepatocyte cluster (1, 3, 5, 6, 14, 15). b Box plot of library size for each hepatocyte cluster with median library size (top) and graphically denoted median (dark horizontal line). Outliers (black dots) and interquartile range (black box) are indicated. c t-SNE plots showing the expression of general hepatocyte markers based on PCA clustering of 8444 cells. c (i) ALB, c (ii) HAMP, c (iii) ARG1, c (iv) PCK1, c (v) AFP, c (vi) BCHE. Legend for relative expression of each marker from lowest expression (yellow dots) to highest expression (purple dots) (top left). c (vii) t-SNE projection showing a reference map of all six hepatocyte clusters. d Pathway enrichment analysis examining active cellular pathways in clusters 1, 3, 5, 6, 14 & 15. The size of the nodes represents the number of genes in a particular pathway. Highly related pathways are grouped into a theme (black circle) and labeled in Cytoscape (Version 3.6.1). Intra- and inter-pathway relationships are shown (green lines) and represent the number of genes shared between each pathway. Periportal and pericentral zones are assigned in relation to correlation analysis between mouse and human liver in Supplementary Fig. 8. Statistical significance of the correlation between mouse liver layers and human liver clusters (denoted under each pathway analysis) calculated using Pearson correlation. ∗∗∗P < 0.001, ∗∗P < 0.01, ∗P < 0.05. t-SNE t-distributed stochastic neighbor embedding

