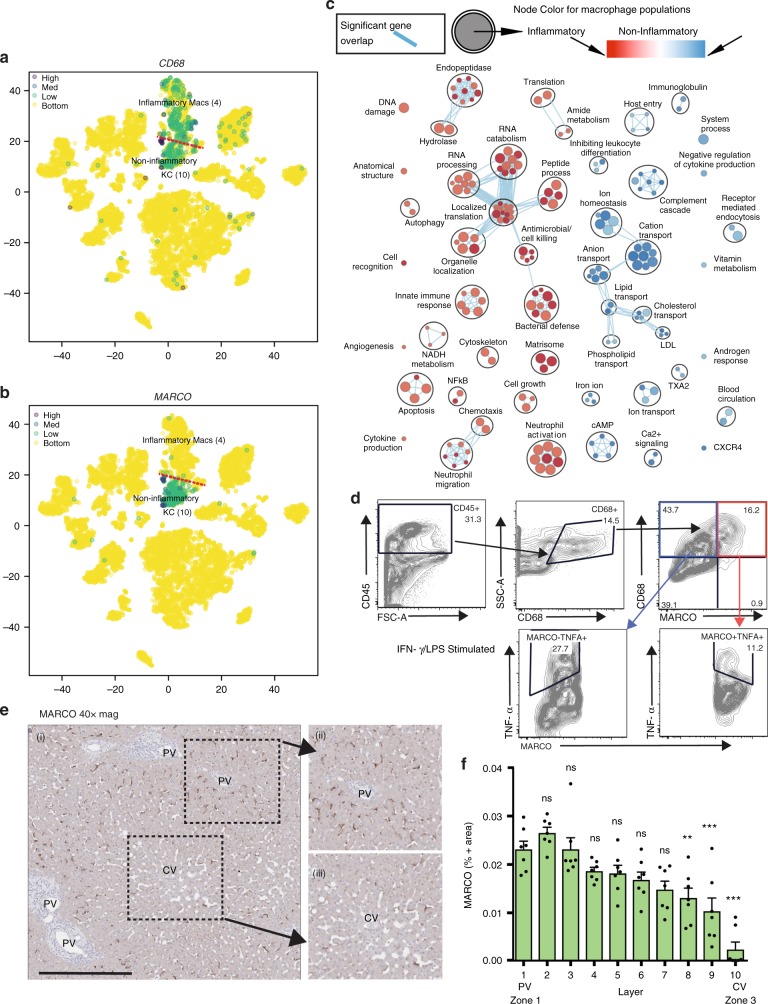
Fig. 8.
ScRNA-seq identifies two distinct populations of human liver resident macrophages/monocytes. a, b t-SNE projection of 8444 liver cells, with each cell colored based on expression of a CD68 and b MARCO. c Pairwise pathway enrichment analysis comparing gene expression in the two CD68+ macrophage clusters defined in Fig 2f. Pathways enriched in non-inflammatory KCs are labeled in blue and pathways enriched in inflammatory KCs are indicated in red. Colored circles (nodes) represent pathways, sized by number of genes they contain. Green lines depict intra- and inter-pathway relationships according to the number of genes shared between each pathway. Black circles group related pathways into themes that are labeled. d Flow cytometry data showing the response of monocytes/macrophages in total liver homogenate cell suspensions to stimulation with 1 μg/ml LPS and 25 ng/ml IFN-γ. Cells were stained with anti-human CD45 (clone: HI30), anti-CD68 (clone: Y1/82 A), anti-MARCO (polyclonal; Invitrogen, PA5-26888, goat anti-rabbit secondary antibody), and anti-TNF-α antibodies. Full gating strategy and controls shown in Supplementary Fig. 15. e, f Distribution of MARCO-positive cells in liver zones 1–3. Scale bar represents 500 μm. Staining was performed on 5–7 μM slices cut from formalin-fixed, paraffin-embedded resected liver tissue. Using anti-MARCO (clone: Invitrogen, PA5-26888) and anti-CD68 (clone: PG-M1) at ×40 magnification. f Quantification of percent MARCO-positive cells in liver zones 1 to 3. Error bars show the standard error of the mean for at least seven replicates. Statistical significance evaluated using a one-way analysis of variance (ANOVA) with a Bonferroni post-test ∗∗∗P < 0.001, ∗∗P < 0.01, ∗P < 0.05

