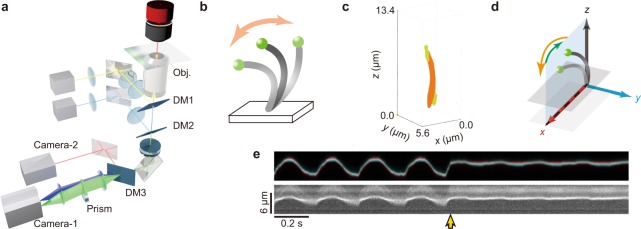
Figure 1.
Schematics of the experimental setup. (a) Experimental setup. Yellow, pale blue and green lines represent optical paths of infrared laser, blue laser and the light emitted from a fluorescent bead, respectively. Blue and green cones in front of Camera-1 represent the paths of the light used to detect the z-displacement of the light emission from the bead. Orange line is the illumination by a deep-red LED used to visualize the mid-portion of a single cilium with differential interference contrast optics (DIC). The term Obj. represents the objective lens. DM1, DM2 and DM3 represent the dichroic mirrors for the infrared laser beam, for the blue laser beam and for the separation of Camera-1(for the DIC image) and Camera-2 (for the fluorescent image), respectively. (b) Schematic illustration of a sample. A single cilium isolated from the murine trachea (the grey curve) was immobilized onto the glass surface by one end, and a fluorescent bead (the green sphere) was attached to the other end. Not to scale. (c) A reconstructed 3-D display of sequential confocal fluorescence images of beads and a single cilium (each images are shown in Supplementary Fig. S1). Green and orange respectively indicate a 200 nm diameter bead and a cilium. A bead located near the ciliary base is a glass attached bead which indicates the surface of a coverslip. Note that bead image was displayed elongatedly along the z-axis, because the thickness of the point spread function of the confocal microscopy along the z-axis is larger than that of x and y-axes. (d) Definition of the three axes. The plane on which the bead trajectory moves most extensively was aligned along the x-axis, and the direction of the effective stroke (forward stroke moving faster) was taken as positive and the recovery stroke was taken as negative (moving slower). The x-z plane was set vertical to the plane of glass slide. (e) An example of a pair of kymographs, representing the spatial positions of a fluorescent bead image (upper) and the middle portion of the single cilium as a DIC image (lower). In a fluorescent bead image, two images separated by the prism were superimposed with different colors, red and blue. The yellow arrow indicates the onset of laser trapping of the bead (cf. Figs 4 and 5).

