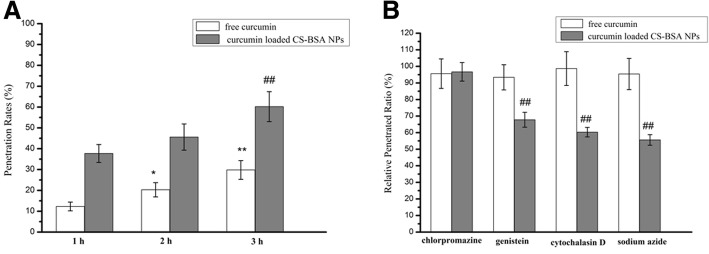
Fig. 2.
Analysis of the penetration mechanism of free curcumin and curcumin-loaded CS-BSA NPs through hCMEC/D3 cells. a Fluorescence spectrum analysis of the penetration rates of free curcumin and curcumin-loaded CS-BSA NPs. Results are expressed as means ± standard deviation (n = 3). *P < 0.05, **P < 0.01 vs the penetration rates of free curcumin at 1 h. ##P < 0.01 vs the penetration rates of curcumin loaded CS-BSA NPs at 1 h. b Effects of endocytic inhibitors on the penetrated ability of free curcumin and curcumin-loaded CS-BSA NPs. Results are expressed as means ± standard deviation (n = 3). ##P < 0.01 vs relative penetrated ratio of curcumin loaded CS-BSA NPs treated with chlorpromazine

