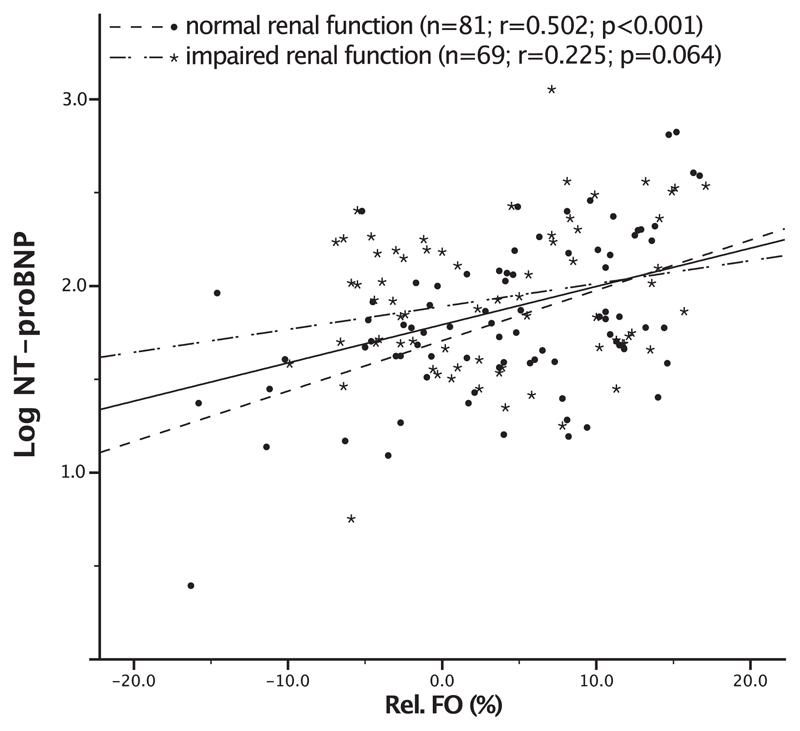
Fig. 2.
Correlation plot between NT-proBNP and relative fluid overload Scatterplot for log N-terminal prohormone of brain natriuretic peptide (NT-proBNP) and relative fluid overload (Rel. FO) according to renal function. The solid line is the regression line for all subjects (r = 0.304; p < 0.001). The dashed line indicates the regression line for patients with normal renal function (r = 0.502; p < 0.001). Patients with impaired renal function showed no significant correlation between NT-proBNP and Rel. FO (dash-dotted line; r = 0.225; p = 0.064).

