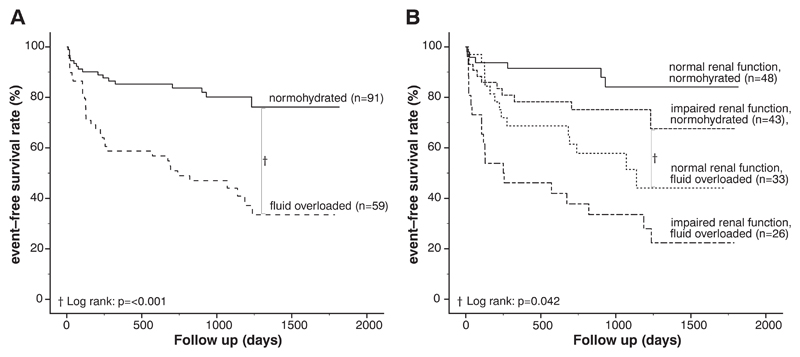
Fig. 3.
Kaplan–Meier curves Panel A: Kaplan–Meier curves according to the two defined groups: [1] Normohydrated and [2] Fluid overloaded. Patients with fluid overload showed an adverse outcome in comparison with normohydrated patients. (p < 0.001). Panel B: Kaplan–Meier curves depicting HFpEF patients stratified by fluid status and renal function. Patients with fluid overload and normal renal function showed a significantly worse event-free survival compared to normohydrated patients with impaired renal function (log-rank: p = 0.042).

