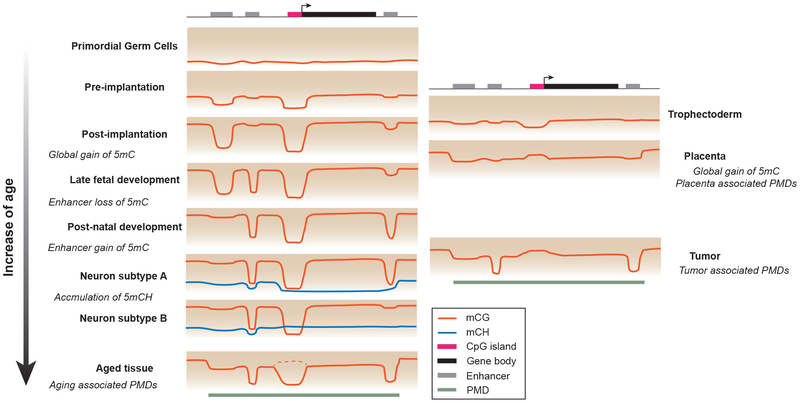
Figure 1.
DNA methylation signatures of developmental stages and tumors - primordial germ cells and preimplantation: low global 5mC level; postimplantation: global gain of 5mC. late fetal development: local demethylation at embryonically active regulatory sequences; postnatal development: gain of 5mC at embryonically active regulatory sequences, loss of 5mC at regulatory sequences active in differentiated tissues. neuron subtypes A and B: brain specific accumulation of mCH, which abundance is inversely correlated with transcription activity; aged tissues: PMDs in late-replication regions resulted from progressive methylation loss. Dashed line indicates a small percentage of CGI shows hyper-methylation in aged tissues (67). trophectoderm: low global 5mC level similar to preimplantation embryo; placenta and tumors: pervasive PMDs and CGI hypermethylation. The color gradient in the background indicates the increase of 5mC level from bottom to top of each panel.

