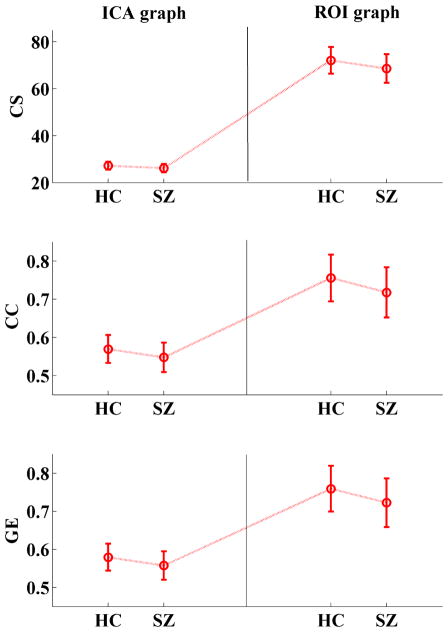
Fig. 4.
Group mean of graph measures in controls and patients with schizophrenia in graph with ICA nodes and ROIs. Error bars correspond to standard deviation. Two sample t-tests show that graph measures are significantly (p < 0.001) lower in patients than controls in both ICA graph and ROI graph. However, p values are lower and effect sizes (Hedges’ g) are higher in ICA graph then ROI graph (see Table 1). (HC: healthy controls; SZ: patients with schizophrenia; CS: connectivity strength; CC: clustering coefficient; GE; global efficiency)

