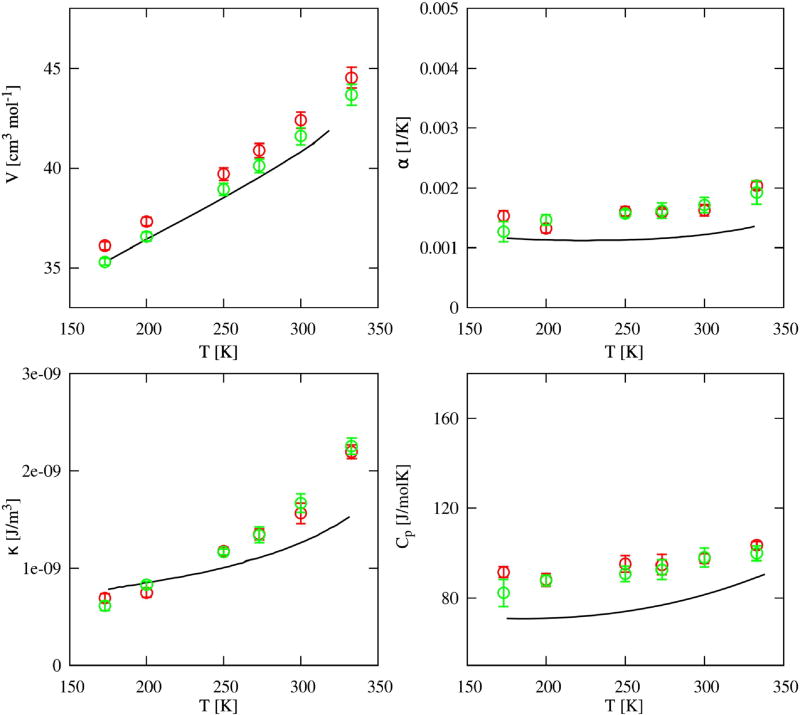
FIG. 13.
Thermodynamic results from experiments (black line) and simulations of 3D methanol models, open red circles for OPLS and green circles for TraPPE model. Top panels hold temperature dependence of volume on the left, and coefficients of isobaric expansion on the right, while bottom panels are temperature dependence of isothermal compressibility on the left and heat capacity on the right. Experimental results are V (T)70–73, α(T)75, κ(T)75, and CP (T)74.

