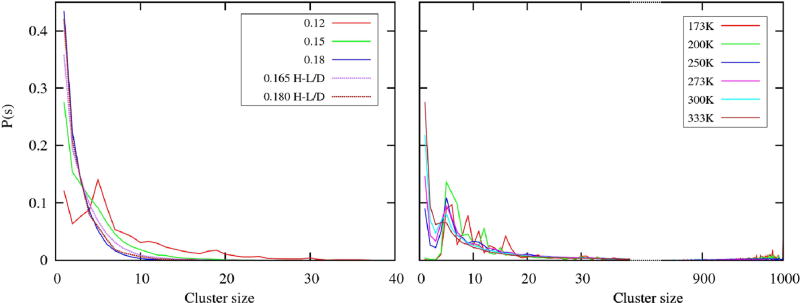
FIG. 7.
Cluster size distributions calculated for 2D (left panel) and 3D methanols (right panel). In order to represent the overall range for both distributions, we used the break in the x-axis for 3D methanols. The right part of the 3D plot shows probabilities for large size clusters, which are close to the size of the system (1000 molecules). The color code is contained in the legend box for each panel.

