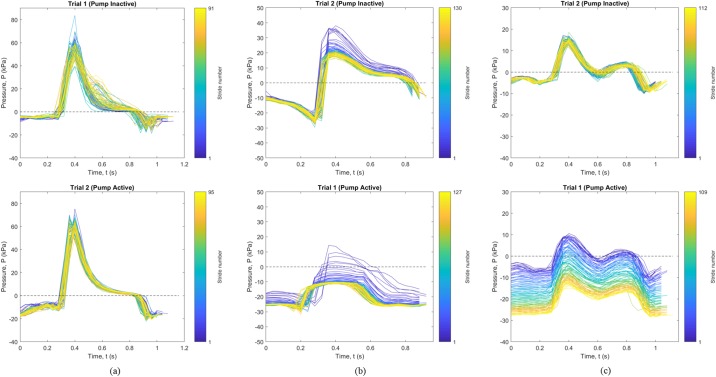
Fig 3. Individual gauge pressure stride data during 2-Minute Walk test.
Data is shown with pump inactive (top) and pump active (bottom), across (a) Participant 1, (b) Participant 2, and (c) Participant 3. Blue indicates the first stride and yellow the last, with the legend indicating total stride count.

