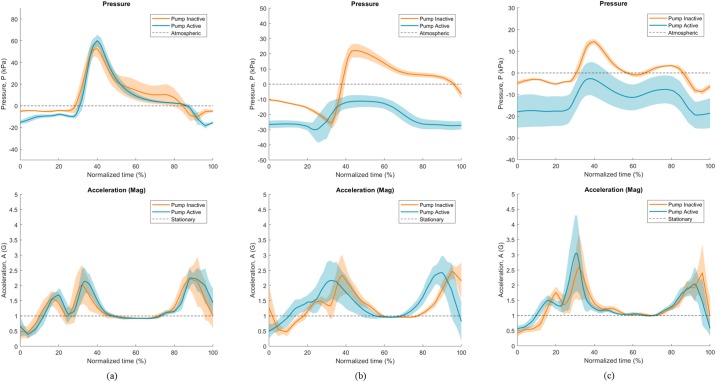
Fig 4. Normalized individual stride data during 2-Minute Walk test.
Data is shown for gauge pressure (top) and magnitude of acceleration (bottom), across (a) Participant 1, (b) Participant 2, and (c) Participant 3. Dark lines indicate average measurements, with shaded areas indicating standard deviation.

