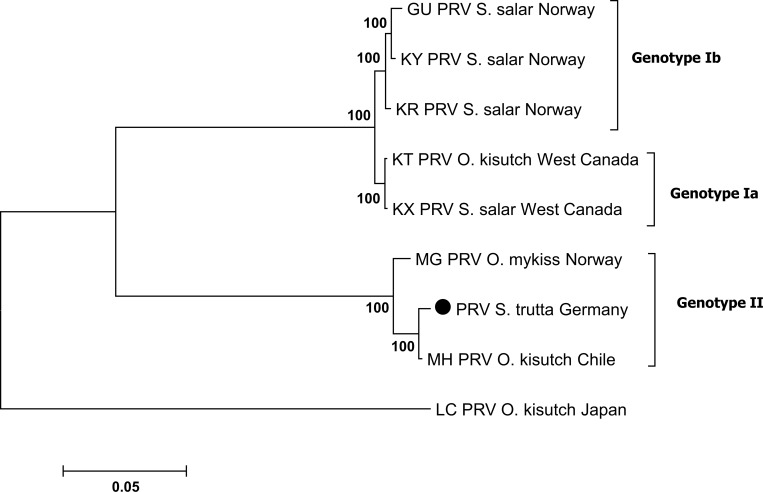
Fig 2. Phylogenetic analysis based on 51.0% of the genome sequence of the novel virus (λ1, λ2, λ3, μ2, μ1, μNS, σ3, σ2, σNS and σ1) and sequences of the piscine reovirus downloaded from the NCBI database.
The scale bar (left below) refers to substitutions per amino acid sites. Numbers on the nodes represent the confidence limits (> 50%) estimated from 100 bootstrap replicates. The cluster definition (Genotype Ia, Ib, and II) is displayed according to Takano et al. [40]. The sequence of this study is symbolized by a solid circle.

