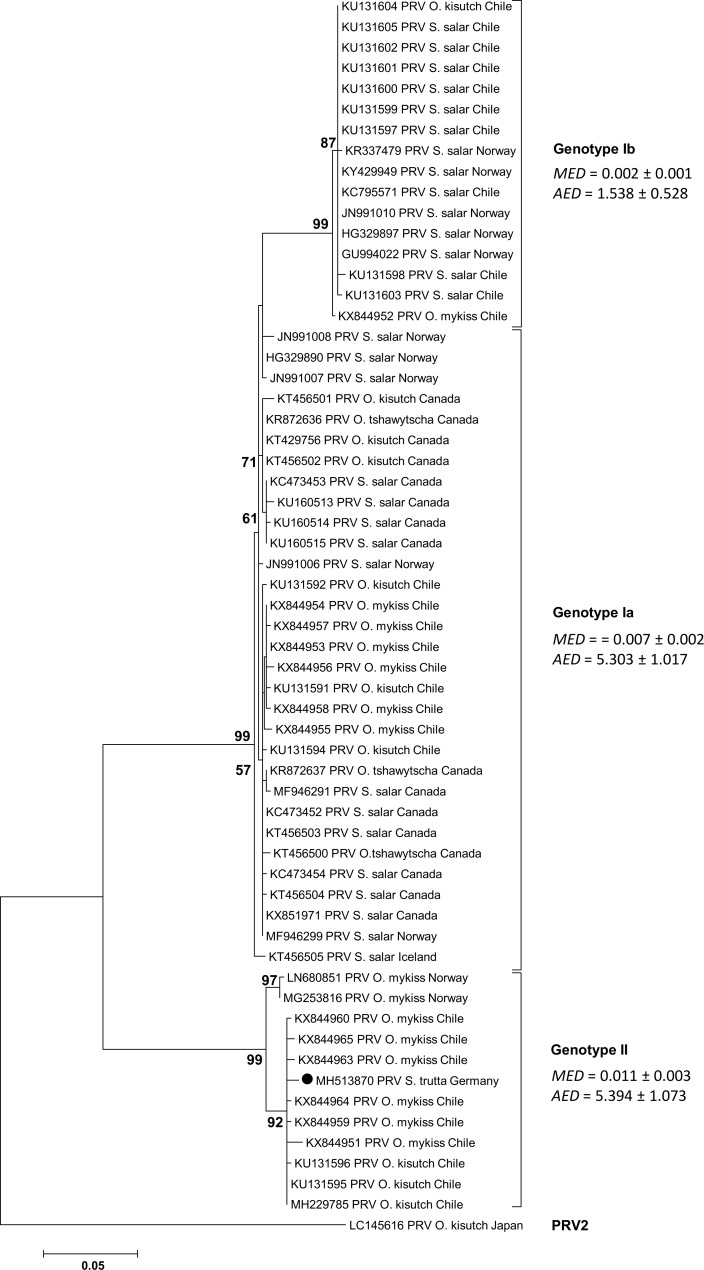
Fig 3. Phylogenetic analysis based on generated S1 sequence of the PRV-S1 from S. trutta, Germany, and sequences of the piscine reovirus downloaded from NCBI database.
For each sequence the current GenBank accession number as well as the location where the virus was detected is shown. The scale bar (left below) refers to substitutions per amino acid sites. Numbers on the nodes represent the confidence limits (> 50%) estimated from 100 bootstrap replicates. The cluster definition (Genotype Ia, Ib, II and PRV 2) is displayed according to Takano et al. [40]. For every cluster the mean evolutionary diversity (MED) and the average evolutionary divergence (AED) was computed with MEGA7 [34]. The sequence of this study is symbolized by a solid circle.

