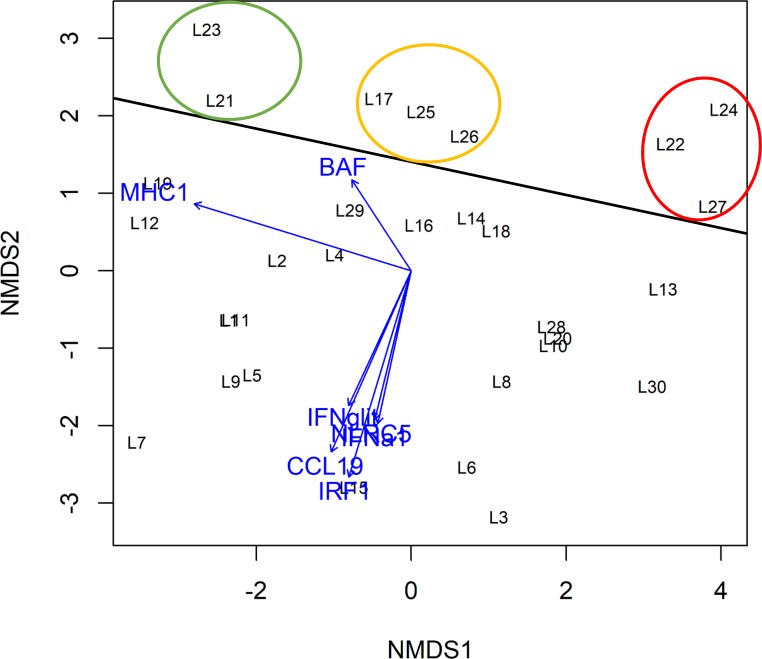
Fig 5. Result of the nonparametric multidimensional scaling (NMDS) with immune response genes (IRG) gene expression profiles of 30 liver samples (L1 to L30).
The genes BAF, CCL19, NLRC5, IRF-1, IFNa1 und IFN-g were most strongly upregulated in the samples L27, L21, L22, L23, L24, L25, L26 and L27 displayed above the black horizontal line. The circles refer to the degree of MHC-I regulation of those samples: strongly downregulated (green circle), slightly upregulated (orange circle) and strongly upregulated (red circle) according to IRG expression profiles.

