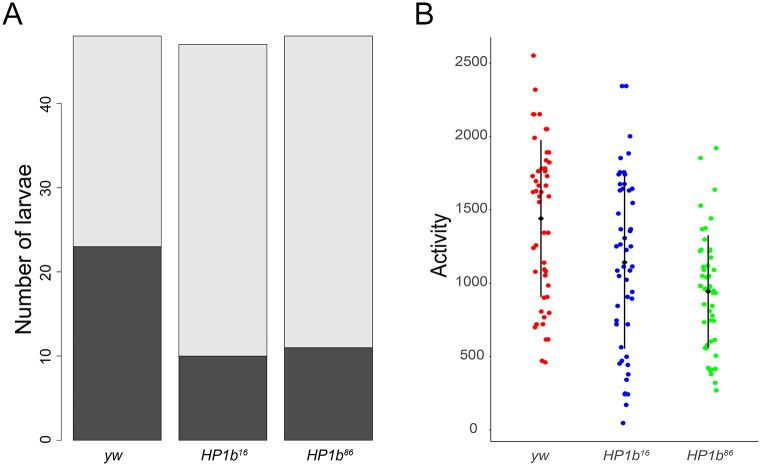
Fig 4. Animals lacking HP1B show decreased levels of activity.
A. A significantly higher fraction of third instar larvae lacking HP1B (HP1b16 and HP1b86) failed to move in a 60 second observation period compared to the yw control (p<0.001 for both comparisons; chi-square test). Dark grey: animals that moved; light grey: animals that failed to move. Y-axis: Number of larvae. N = 47–50 per genotype. B. Adult animals lacking HP1B show significantly lower activity levels than animals of the yw control genotype (p<0.001 for both comparisons; Tukey’s HSD). Y-axis: activity level as measured by recorded beam crossings in an activity monitor for 10 flies within a 2hr assay period. Black diamond and bar: mean +/- SD. N = 50 per genotype.

