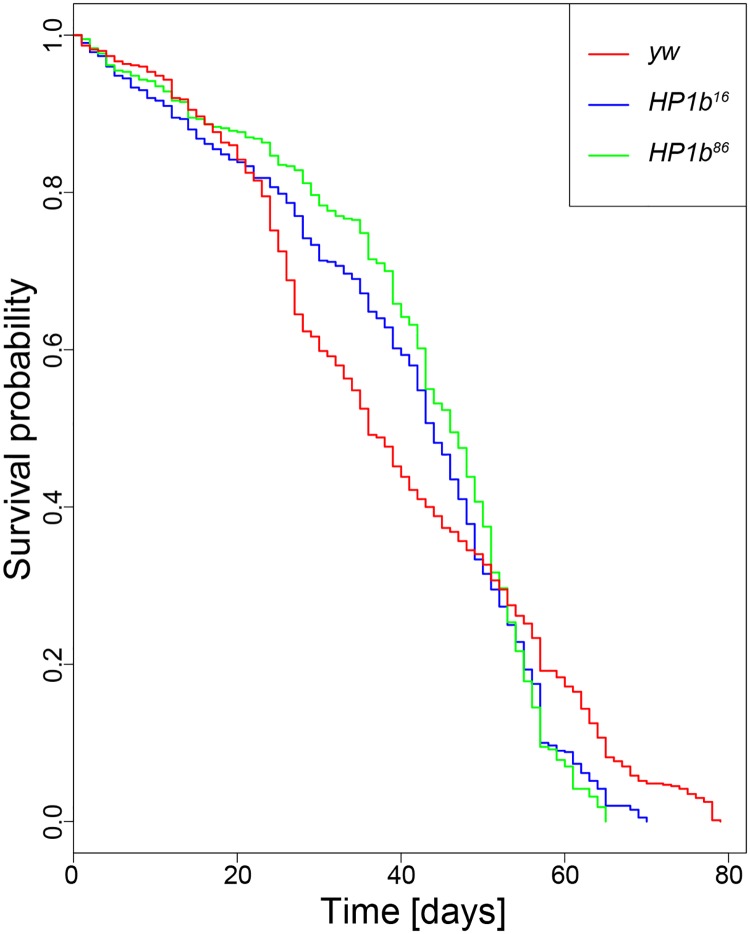
Fig 6. Loss of HP1B impacts survival.
Survival curves differ significantly between the HP1b mutant strains and the yw control strain (p = 0.0483; log rank test). X-axis: Time to death in days. Y-axis: Survival probability. Data shown are combined from three trials, each with 100 animals per genotype/sex. For separate survival curves for males and females, see S4 Fig.

