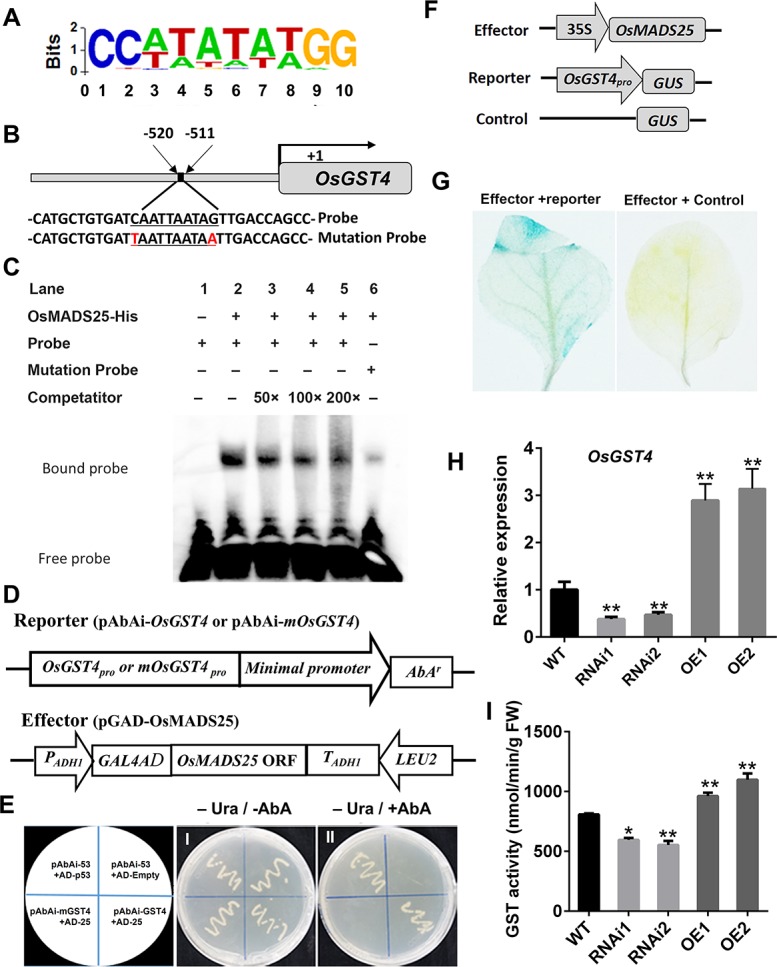
Fig 4. Cis–element binding ability and transcriptional–activation assays of OsMADS25.

A. Nucleotide frequency distribution of the OsMADS25 core binding consensus sequence as determined ChIP–seq analysis. B. Schematic diagram of OsGST4 promoter region showing the CArG–box motif. C. Electrophoretic mobility shift assays (EMSA) indicating OsMADS25 binding specific CArG–box motif located in the promoter region of OsGST4. D. Schematic diagrams of the effector and reporter used in the yeast one–hybrid assay. E. Transcriptional–activation assays showing OsMADS25 having transactivation activity in yeast. Panel (I) shows yeast cells containing distinct effector and reporter constructs grown on an SD/-Ura medium without AbA (–Ura; –AbA). 1. pGADT7–p53/p53–AbAi (positive control); 2. pGADT7/p53–AbAi; 3. pAbAi–mOsGST4/pGADT–OsMADS25; 4. pAbAi–OsGST4/pGADT–OsMADS25. Panel (II) shows that yeast cells shown in panel (I) cultured on SD/–Ura medium containing 200 ng ml-1 AbA (–Ura; +AbA). F. Schematic diagrams of the effector and reporter used for transient transactivation assay in Nicotiana benthamiana. G. Transactivation activity detected by GUS staining after reporter and effector plasmids coinfiltrated into the leaves of N. benthamiana. H. The transcript levels of OsGST4 in 7–day–old wild type and OsMADS25 transgenic roots by qPCR analysis. I. Measurement of GST activity in 7–day–old wild type and OsMADS25 transgenic roots. WT, wild type. RNAi1 and RNAi2, OsMADS25–RNAi transgenic lines. OE1 and OE2, OsMADS25 overexpression lines. Three independent experiments were performed. Data are means ± SE (n = 10). The statistical significance of the measurements using one-way analysis of variance (ANOVA) was determined using Student’s t-test. Asterisks indicate the significant difference between OsMADS25 transgenic lines and WT plants (*P < 0.05, **P < 0.01 or ***P < 0.001).
