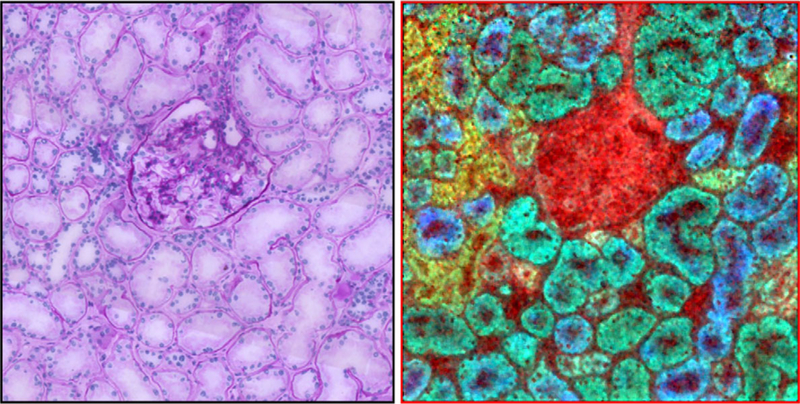
Figure 3.
IMS ion overlay image of three distinct molecular entities in a section of human kidney (right panel) showing the glomerulus in the center surrounded by proximal and distal tubules. The image was taken at 1 μm spatial resolution using a transmission geometry ion source. An H&E-stained microscopy image is shown for comparison (left panel). The color codes for the IMS image are as follows: red (m/z 750; PE(P-38:4)), yellow (m/z 863; PI (36:1)), green (m/z 885; PI(38:4)), and blue (m/z 1052; SM3 (d18:1/24:0)). (Figure reprinted with permission from Reference 6, Grove thesis)

