
Fig. 2.
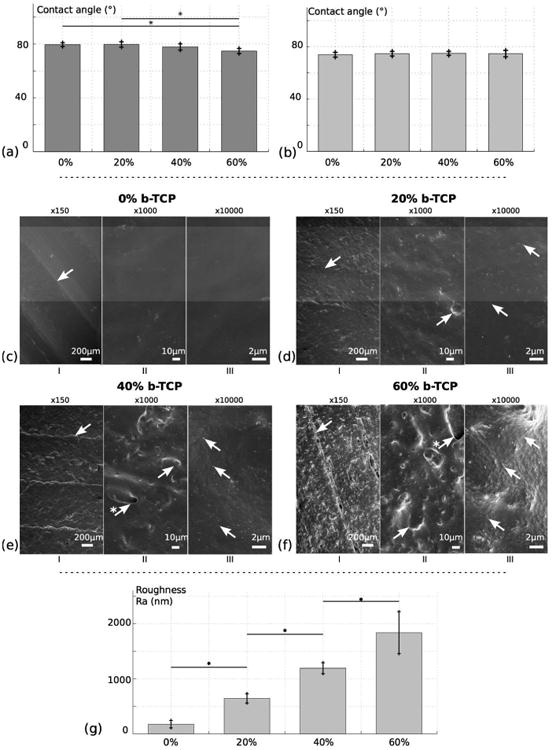
Surface analysis of 3D printed PCL/β-TCP scaffolds with different ceramic amount: 0%, 20%, 40%, 60%. (a) Contact angle measurement after post-processing. (b) Contact angle measurement without post-processing. (c) to (f) SEM imaging of the scaffolds for respective composition of 0%, 20%, 40%, 60%. (g) Surface roughness measurement Ra for the different ratios. For SEM, different magnifications are observed: ×150 (I), ×1000 (II) and ×10000 (III). In (I), arrows indicate linear ridges resulting from 3D printing. In (II), arrows highlight ceramic aggregates, sometimes resulting in holes at the surface (arrows marked with *). In (III), arrows are pointing towards β-TCP nanoscopic particles.