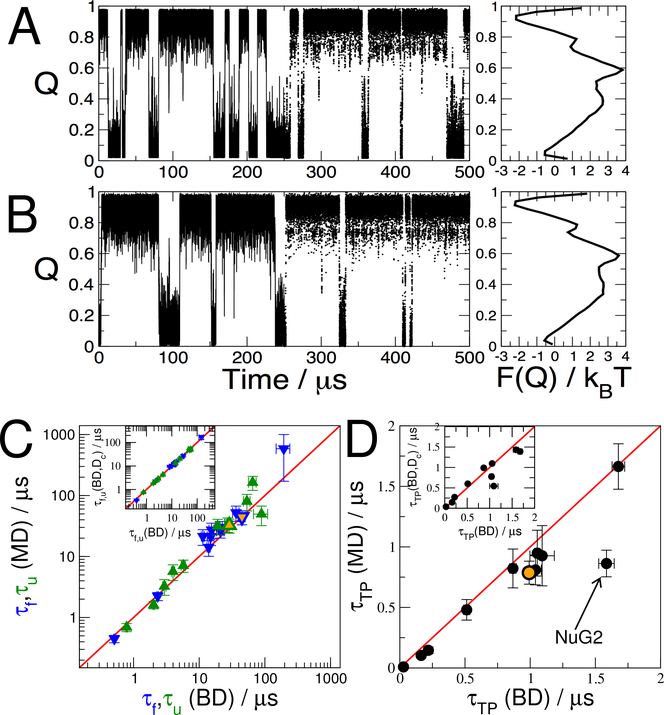
Figure 2:
Comparison of MD simulations with diffusive dynamics. A: Brownian dynamics (BD) simulations Q(t) using parameters from the 1D diffusion model on Q for the GTT WW domain. The first and second halves of the trajectory are shown as lines and points respectively; the potential of mean force (PMF) is shown on the right. B: Corresponding projection Q(x(t)) of MD trajectories x(t) for GTT WW domain, and PMF on right. C: Folding (blue) and unfolding (green) times from MD simulation compared to those predicted from Brownian dynamics (BD) using the 1D diffusion model. D: Transition-path durations τTP for BD and MD compared. The outlier NuG2 is indicated. Orange-filled symbols in (C) and (D) indicate results obtained with the optimized Qopt coordinate for NuG2. Insets in (C) and (D) compare results obtained with the original diffusion model using position-dependent diffusion coefficients D(Q) and with one using a constant diffusion coefficient, Dc defined in Eq. 5.

