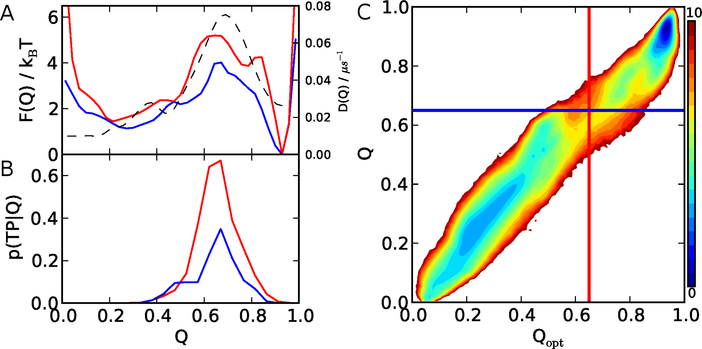
Figure 4:
Protein G reaction coordinates. A: 1D free energy profiles for the original fraction of native contacts Q (blue) and the optimized coordinate Qopt (red). The diffusion coefficient as a function of Qopt is shown by a broken line. B: p(TP|Q) for Q (blue) and Qopt (red). C: 2D free energy surface as a function of Q, Qopt. Blue and red lines indicate the barrier position on 1D free energy profile for Q and Qopt, respectively. Color bar indicates the free energy in unit of kBT.

