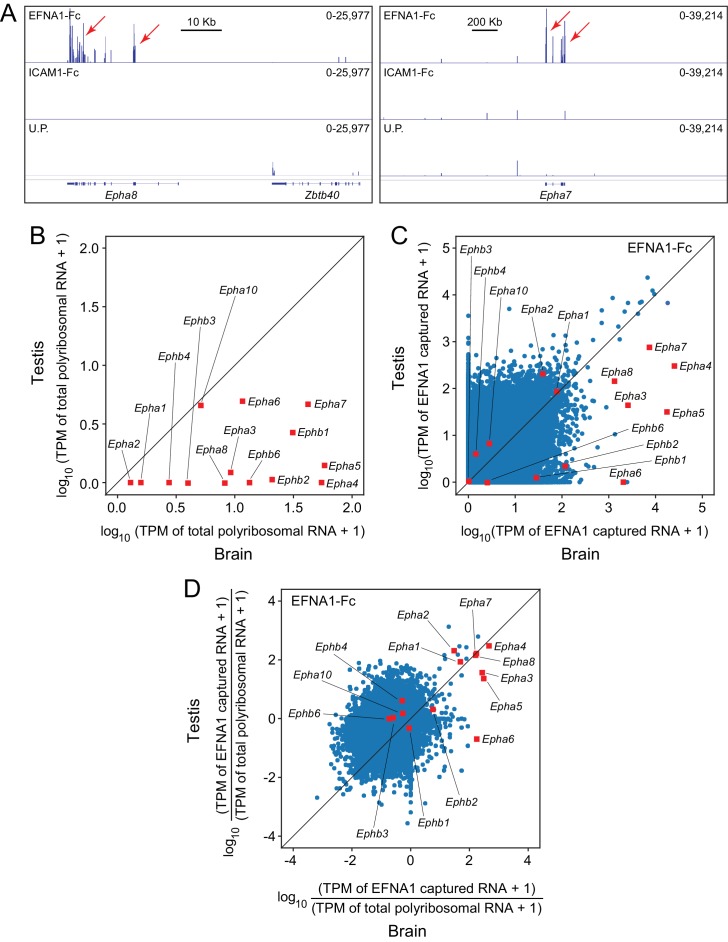
Figure 7. ACAPseq using polyribosomes from mouse testis.
(A) Epha8 and Epha7 mRNAs captured with EFNA1-Fc baits (red arrows). Genome browser images, as shown in Figure 1B. (B) Abundances of transcripts coding for EPHA and EPHB family members in testis vs. brain total polyribosomes. (C) ASP of EFNA1-Fc captured from testis vs. brain polyribosomes. (D) Comparison of testis vs. brain EFNA1-Fc ACAPseq, with read counts from each captured transcript normalized to the starting abundance of that transcript.

