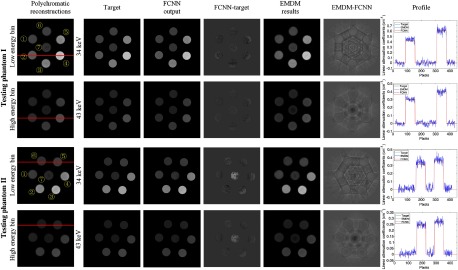
Fig. 7.
The FCNN outputs of testing phantom I and testing phantom II, compared with results of EMDM. Testing phantom I consists of ① 17% , ② 7% NaCl, ③ 7% , ④ 19% NaCl, ⑤ 7% , ⑥ 7% and ⑦ . Testing phantom II consists of ① 17% , ② 7% , ③ 9% , ④ 12% NaCl, ⑤ 21% , ⑥ 22% , and ⑦ 47% . The dual-energy CT images (, the same below) are reconstructed in low energy bin [25.3 32.5] keV and high energy bin [32.5 46.9] keV. Due to the nonuniformity of PCD, the CT images were severely influenced by ring artifacts. Target images are ground truth of linear attenuation coefficients obtained from NIST. The FCNN outputs VMA maps at and . The difference between FCNN VMA maps and target images can be seen clearly. Additionally, we compared the VMA maps with ones from EMDM by polynomial fitting. The difference between two methods can be observed as well. The profiles of red line show that FCNN could reduce noises evidently. In both EMDM and FCNN methods, pixels of tube walls and out of FOV are not taken into consideration. The display window of differences between FCNN outputs and target images is and of differences between FCNN outputs and EMDM fitting results is . Others all are [0, 0.70]. The units of display windows are all .

