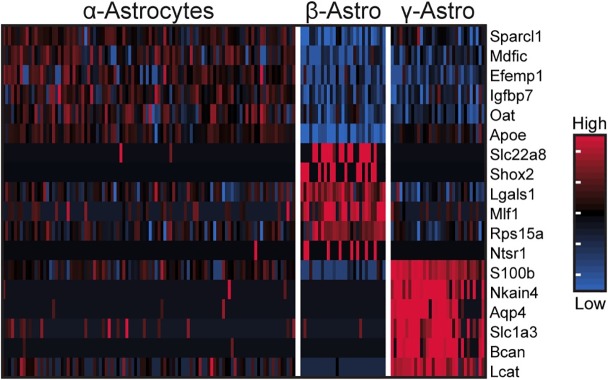
Fig 4. scRNA-seq reveals three transcriptionally distinct astrocyte populations.
Heatmap of expression values for top 6 most differential expressed genes (by effect size) for α-, β-, and γ-astrocytes. Expression values are Z-scores of counts calculated between all cells of the three cell types. Each column represents one cell; random sample of 100 cells from α-astrocytes are shown; all β- and γ-astrocytes are shown. See also S1 Fig.

